// Documentation Guide
Funding Tracker
Live and historical perpetual funding rate for the active symbol, with predicted-next rate and countdown to the next funding interval.
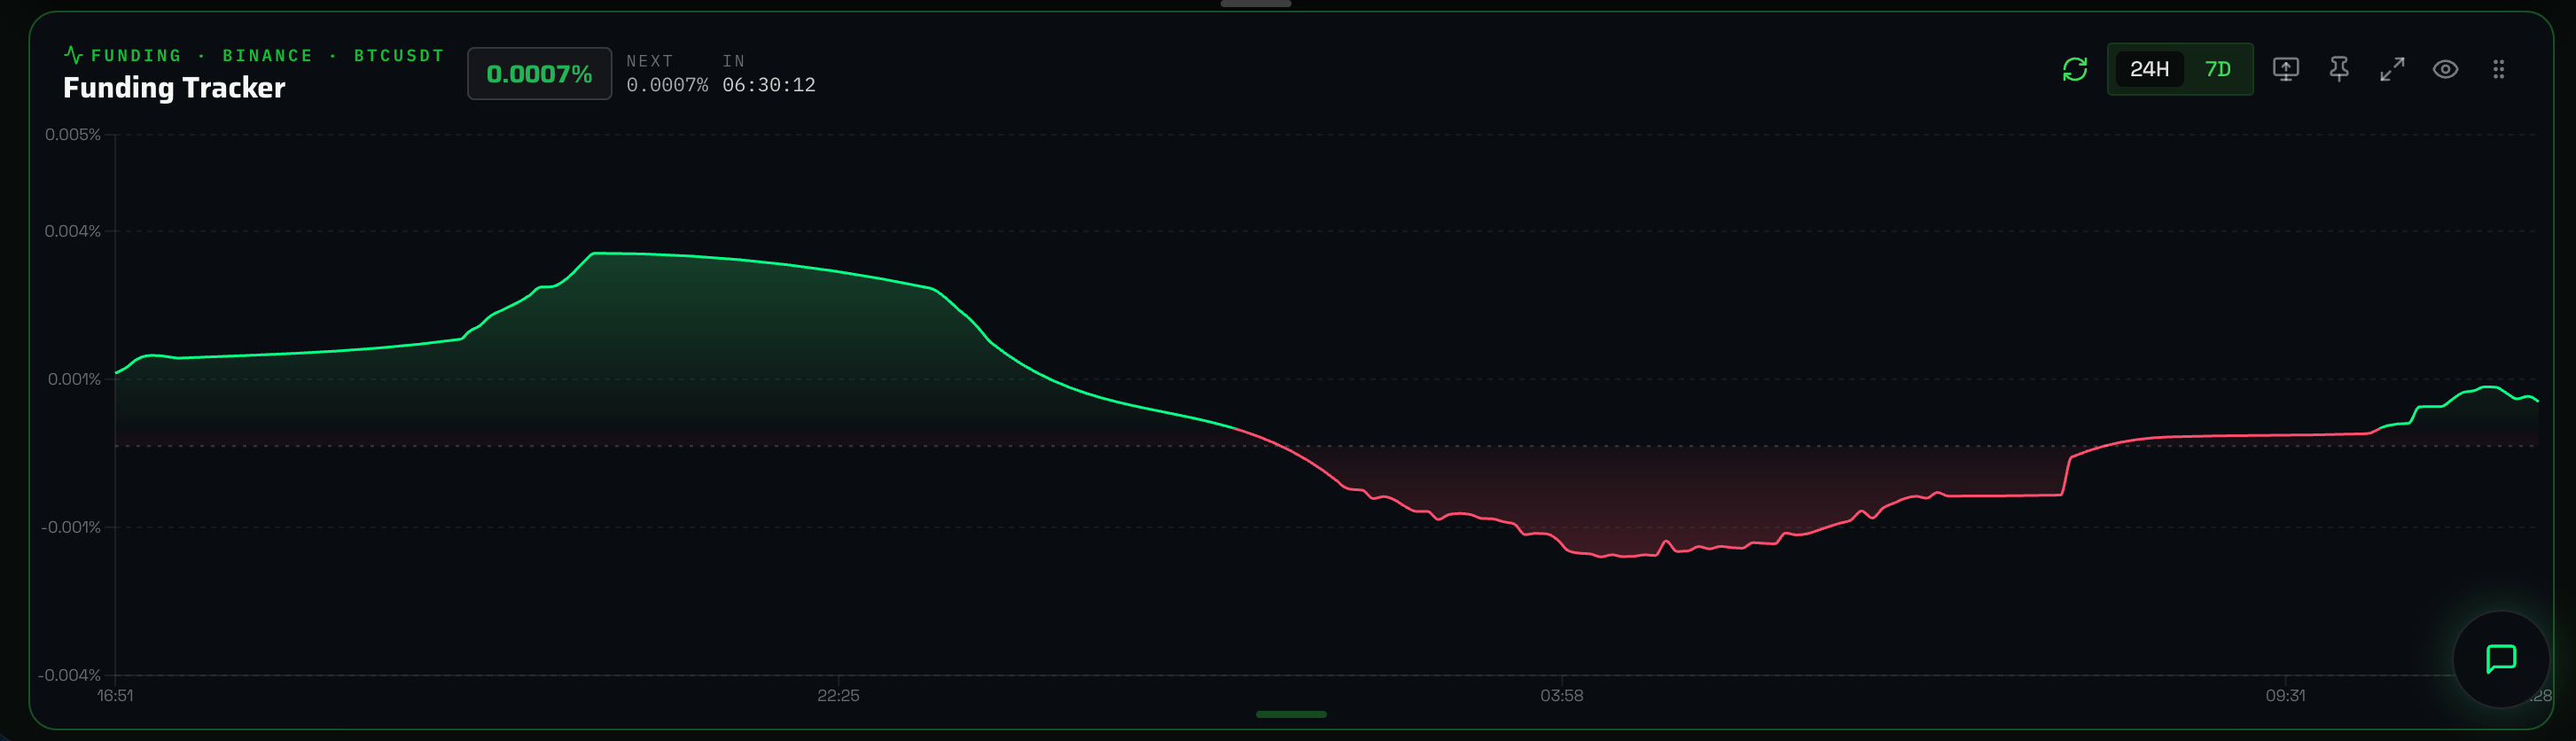
What it shows
Funding Tracker follows the symbol currently selected on the chart and displays:
- Current funding rate — color-coded by sign (green for positive, red for negative).
- Predicted next rate — the estimated rate for the upcoming funding settlement.
- Countdown — time remaining until the next funding settlement (
HH:MM:SS). - History chart — an area chart of past funding prints, plotting positive values above zero (green) and negative values below (red).
This widget answers:
What premium is the perpetual-futures crowd paying right now, what will they pay next, and how has this pressure evolved recently?
How to read it
- Positive funding: Longs pay shorts. Indicates a crowded long side.
- Negative funding: Shorts pay longs. Indicates a crowded short side.
- Rising magnitude: Positioning is becoming increasingly lopsided.
- Predicted vs current divergence: The next settlement will drift toward the predicted value as new trades execute.
- Countdown nearing zero: The displayed predicted rate closely aligns with the final settlement value.
Window toggle
The header toggle switches between two historical ranges:
- 24H — last 24 hours of funding settlements (3 prints on 8h-interval exchanges like Binance).
- 7D — last 7 days (~21 prints).
Switching the window instantly refreshes the historical chart without interrupting the live rate tick.
Data source
The widget merges two data streams:
- Historical Actuals: Past realized funding settlements retrieved from the database.
- Live Tick: The real-time predicted next funding rate, mark price, and countdown to settlement.
When to use it
Pair funding data with Open Interest and price action:
- Rising price + rising funding → heavy long crowding; momentum remains trend-following.
- Flat price + extreme funding → positioning is stretched; high mean-reversion risk.
- Strongly negative funding + rising open interest → crowded shorts; high short-squeeze probability.
Limitations
- The live tick originates from the Binance
markPrice@1sstream. For non-Binance exchanges, historical data is accurate, but the live tick relies on SSE updates. - Funding alone is not an entry signal; use it to read positioning context alongside order flow and market structure.
- Actual funding settles only at the exact interval boundary. Between settlements, the displayed "current" value is a drifting estimate.