// Indicator Manual
Basis Sentiment
Measure whether the derivatives market broadly trades at a premium, discount, or near parity compared to the spot market.
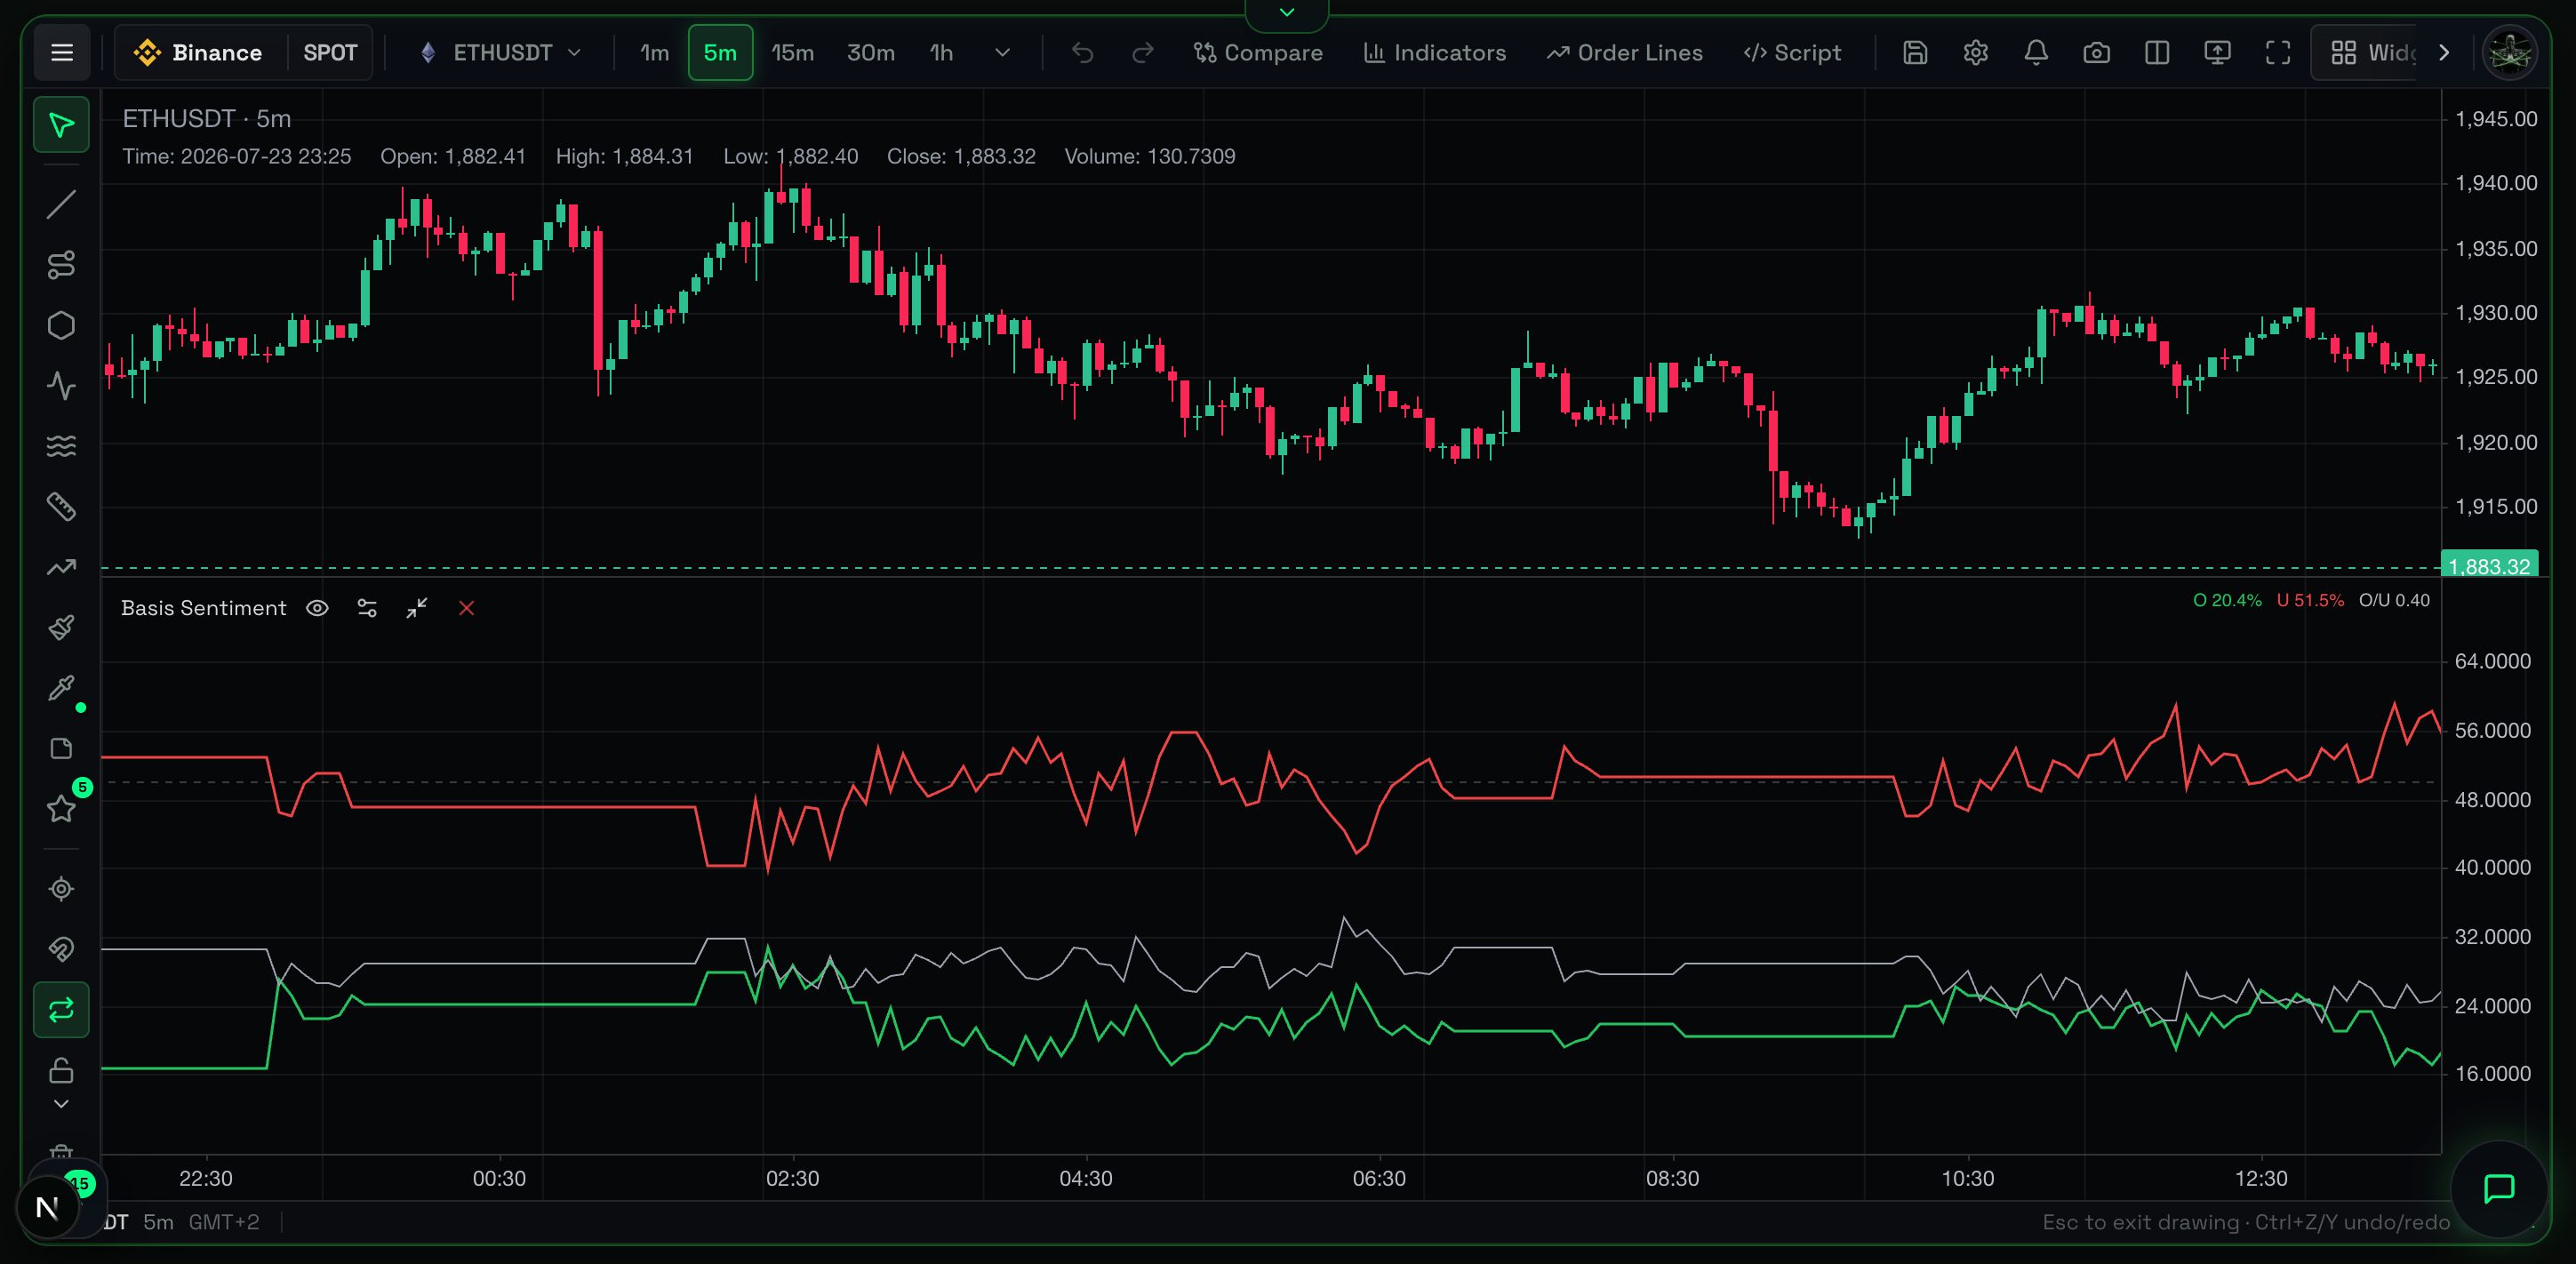
Overview
Basis Sentiment is a macro market regime indicator. It measures the "Basis" — the price difference between a Perpetual Futures contract and its underlying Spot asset — aggregated across the entire market. It determines if the broader market is driven by bullish futures speculation, defensive shorting, or a healthy balance.
What It Shows
This indicator groups all tracked trading pairs into three core states:
- Fut > Spot (Premium): Number of pairs where futures trade higher than spot.
- Fut < Spot (Discount): Number of pairs where futures trade lower than spot.
- Neutral: Number of pairs trading at or near parity.
It also displays summary statistics like Average Basis, Median Basis, and extremes (Min/Max Basis) to expose skew severity.
Why It Matters
In a healthy uptrend, futures usually trade at a slight premium to spot. When the premium gets too high (extreme Fut > Spot share), derivatives traders are bidding up prices using leverage without spot buyers supporting the move. This often precedes violent long squeezes. When the market is heavily in discount, it signals widespread fear and defensive shorting, providing fuel for a short squeeze.
How to Read It
- High Futures Premium Share: Bullish derivatives crowding. Watch for a top or a long squeeze.
- High Futures Discount Share: Bearish crowding. The market is aggressively shorting, making it vulnerable to a short squeeze.
- High Neutral Share: A balanced, healthy market structure. Price action is driven by actual spot buying/selling rather than leverage.
- Divergence: If price makes a new high but the
Fut > Spotshare drops, the rally is driven by spot buyers rather than leveraged speculators (a bullish signal).
Practical Use Cases
- Identifying Regime Shifts: A sudden shift from a high premium regime to a high discount regime often confirms a local market top broke and a new downtrend started.
- Context for Breakouts: If Bitcoin breaks major resistance and the Basis Sentiment shows extreme premium across all altcoins, the breakout might be over-leveraged and prone to a fakeout.
- Spotting Fear: A sustained period of high discount share during consolidation means the crowd is terrified and heavily short. This creates an ideal environment to build a long position.
Example Scenario
The market rallies for weeks. Suddenly, the Basis Sentiment indicator shows 90% of pairs are in a Fut > Spot premium, and the Average Basis spikes to historical highs. The rally is exhausted and running purely on leverage fumes. Tighten stop-losses on long positions and look for order-flow triggers to enter short.
Common Mistakes
- Using it for micro-timing: Basis Sentiment is a macro regime tool, not a precision execution trigger. High premium can persist for days before a flush.
- Ignoring low pair counts: If the indicator tracks only 3 pairs, a "66% premium share" is meaningless. Ensure the aggregation includes enough pairs to be statistically significant.
Limitations
- It aggregates data across many pairs, describing the broad market, not a specific symbol.
- It is a slow-moving, contextual metric, not a fast execution tool.
Related Indicators
- Funding Rate: Often correlates with Basis, confirming how much premium traders pay to hold leverage.
- Account Sentiment: Checks if extreme basis is driven by the retail crowd.
- Open Interest: High premium is more dangerous if Open Interest also hits new highs.
For Advanced Users
Calculation Logic & Settings
The Basis is calculated by comparing the real-time mark price of Perpetual Futures contracts against their underlying Spot market index prices.
Execution Note: To avoid artificial spikes caused by low liquidity on the bid/ask spread, this indicator strictly uses the order book mid-price rather than the last traded price.
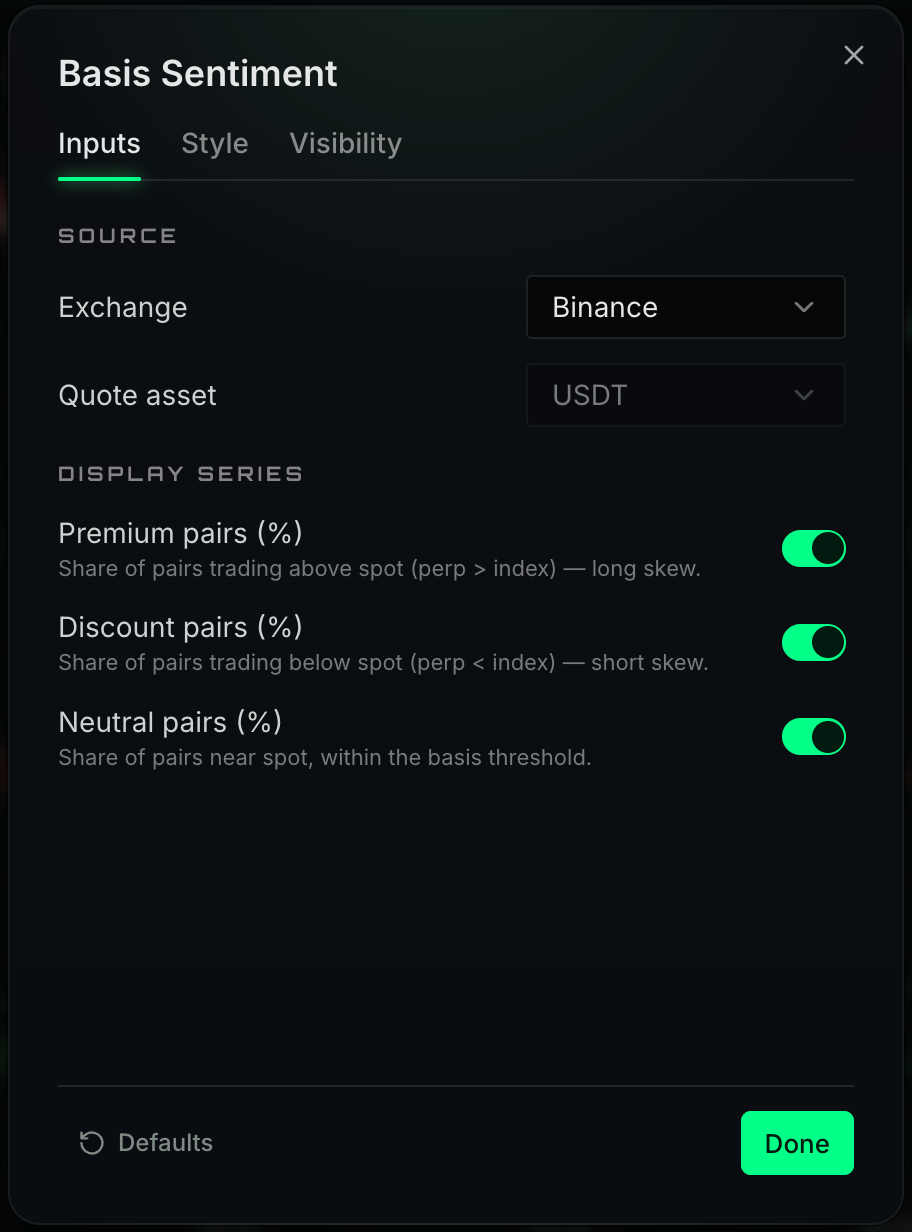
Use the configuration panel to define spot and futures price sources, and choose how the basis aggregates across multiple pairs.