// Indicator Manual
Liquidation Heatmap
Map predictive leverage-driven liquidation pools around price to identify potential squeeze magnets.
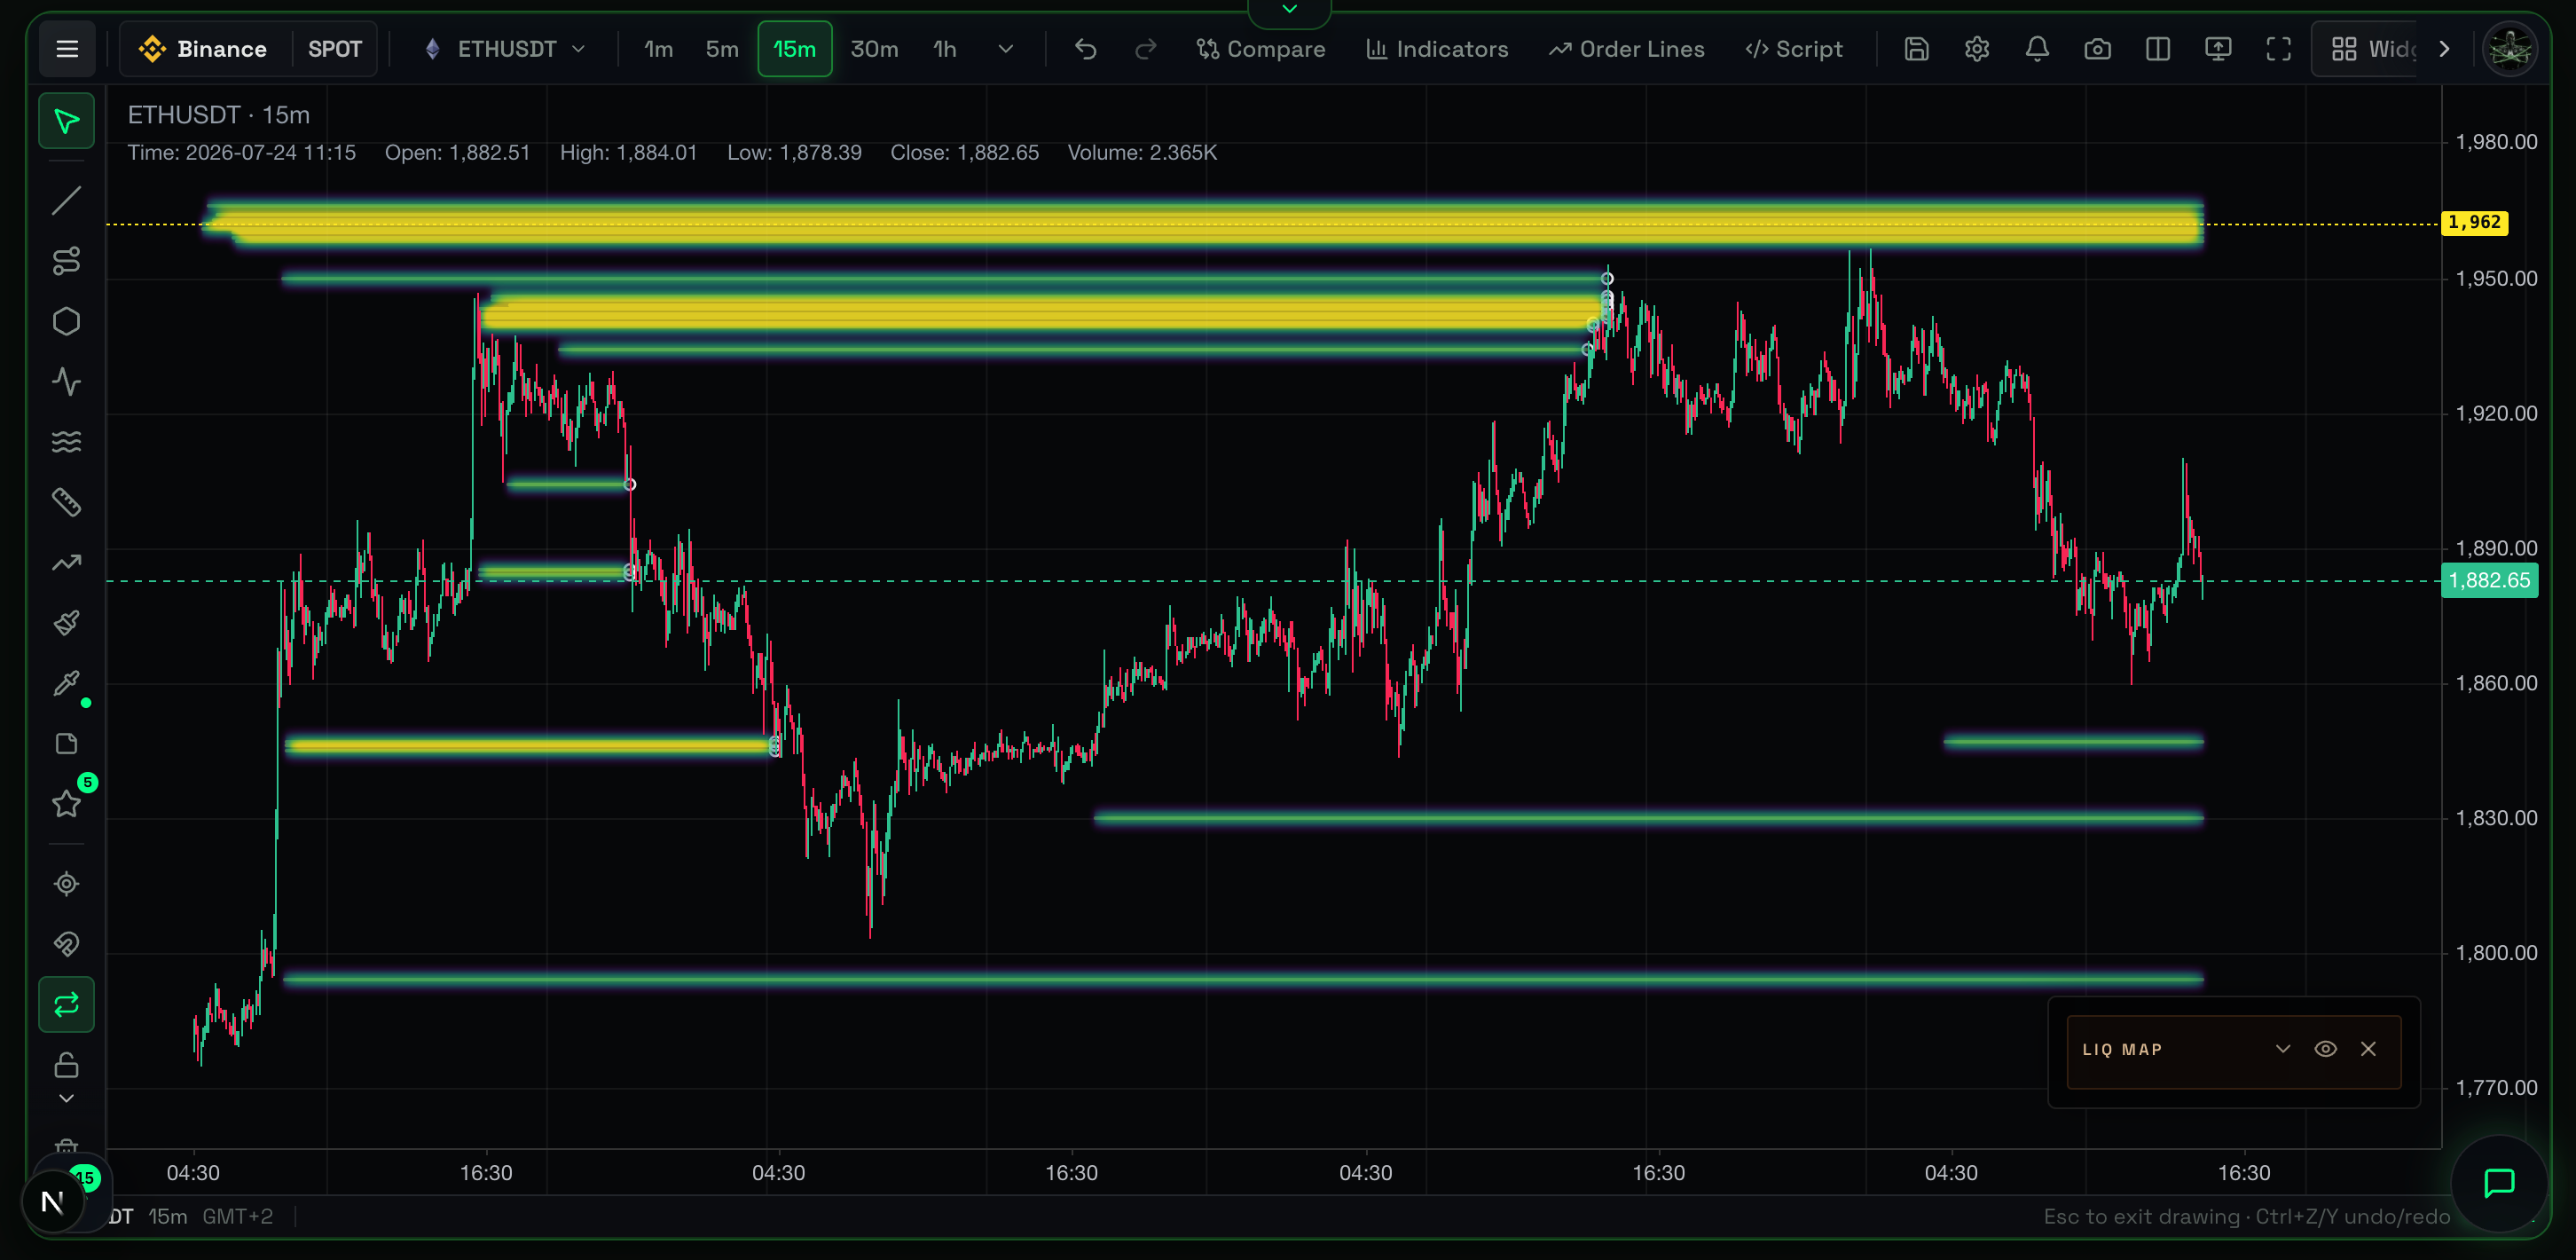
Overview
The Liquidation Heatmap visualizes where high-leverage traders have their stop-losses and liquidation prices hiding on the chart. These vulnerable liquidity pools act as "magnets." Traders anticipate where the market is likely to spike to trigger forced liquidations and sweep the board.
What It Shows
Instead of showing historical trades, the Heatmap mathematically models open futures positions and calculates where those positions go bankrupt if price moves against them.
- Bright Yellow/White Zones: High concentration of estimated liquidations. Massive "pools" of forced liquidity.
- Dim Red/Purple Zones: Low concentration. Very few liquidations rest here.
- Zones Above Price: Estimated liquidation prices of aggressive short sellers.
- Zones Below Price: Estimated liquidation prices of aggressive long buyers.
Why It Matters
Institutional algorithms and large players (whales) need massive liquidity to enter and exit huge positions without causing slippage. The brightest areas on the Liquidation Heatmap act as giant pools of guaranteed, forced liquidity. The price is naturally drawn to these bright zones. Once price hits the zone, forced market orders (liquidations) fire off, allowing whales to absorb them.
How to Read It
- Price trending toward a bright zone: The market hunts for liquidity. A squeeze into that zone is highly likely.
- Price piercing a bright zone: Expect high volatility. Once price enters the zone, a chain reaction of liquidations fires off rapidly.
- Price bounces away before hitting a zone: The opposing side is too strong. The market maker might let price drift the other way to hunt the closer liquidity pool first.
Practical Use Cases
- Targeting Take Profits: If you are in a long position, a bright yellow liquidation pool above current price is an excellent take-profit target. Price is highly likely to spike into it.
- Fading the Sweep (Reversals): Wait for price to spike aggressively into a massive, bright liquidation pool. Once the pool is "swept" (confirmed by Liquidation Bubbles), the liquidity hunt ends. The price often reverses sharply. This is a classic "sweep and reverse" setup.
- Avoiding Traps: Never place a stop-loss directly inside a bright yellow zone. You add to the liquidity pool market makers hunt. Hide stops behind the pools.
Example Scenario
Bitcoin trades in a tight range at $65,000. You check the Liquidation Heatmap and see a massive, bright yellow block at $68,000 (heavily leveraged shorts). The chart below price is dim. You go long. A few hours later, price surges rapidly, slicing through the $68,000 block as shorts are forcibly liquidated. This triggers a massive green spike. As soon as the block is swept, you close your long for a quick profit. The primary magnet is consumed.
Common Mistakes
- Assuming it's a guaranteed path: The heatmap maps pressure, not a crystal ball. A bright pool at $100k does not mean price will instantly go there.
- Confusing it with the Order Book: The Order Book shows willing limit orders that traders can cancel at any time. The Heatmap shows forced liquidation levels that traders cannot cancel unless they close positions at a loss.
Limitations
- It is predictive modeling based on open interest and leverage assumptions. It estimates, rather than exactly accounting for exchange databases.
- The brightest pool is not always hit first. Market mechanics hunt the path of least resistance.
- Needs confirmation from actual execution tools (CVD or Liquidation Bubbles) once price reaches the zone.
Related Indicators
- Liquidation Bubbles: Predict the destination with the Heatmap, and see actual liquidations fire off with Bubbles when price arrives.
- Liquidity Depth: Compare resting limit orders to liquidation levels. Whales often place huge limit orders directly in front of liquidation pools to protect them.
For Advanced Users
Asset Class Context
Liquidations are a derivatives concept. The heatmap automatically pulls data from the corresponding Futures market, even if your main chart views a Spot asset. This ensures you never lose sight of leverage traps.