// Documentation Guide
Anomaly Screener
Multi-tab dashboard widget that detects volume spikes, order-book walls, trade climaxes, and liquidation surges across all symbols in real time.
What it shows
Anomaly Screener subscribes to all anomaly streams emitted by the QUANTIX processor and presents them through specialized views. It identifies statistically unusual market events as they occur.
The widget detects five classes of events:
- Volume Spike — a one-second trade-volume bucket with a Z-score exceeding 3σ against its rolling 100-second baseline. Identifies side (
BUY/SELL). - Limit Wall — Order-Book Imbalance (
OBI) exceeding0.8at specific depth bands (±1.5%,±3%,±5%,±8%,±10%). Identifies dense buy walls or sell walls with a per-depth breakdown. - Trade Climax — current second's trade count exceeds twice the rolling 60-second average. Direction-agnostic burst of activity.
- Liquidation Spike — liquidation USDT-notional in the current minute exceeds three times the 20-minute rolling baseline.
- Spoofing Detected — a massive limit wall placed outside the spread that vanishes quickly without execution. Flags potential book manipulation. Severity scales with notional size and distance from mid-price.
How to read it
The header contains five tabs:
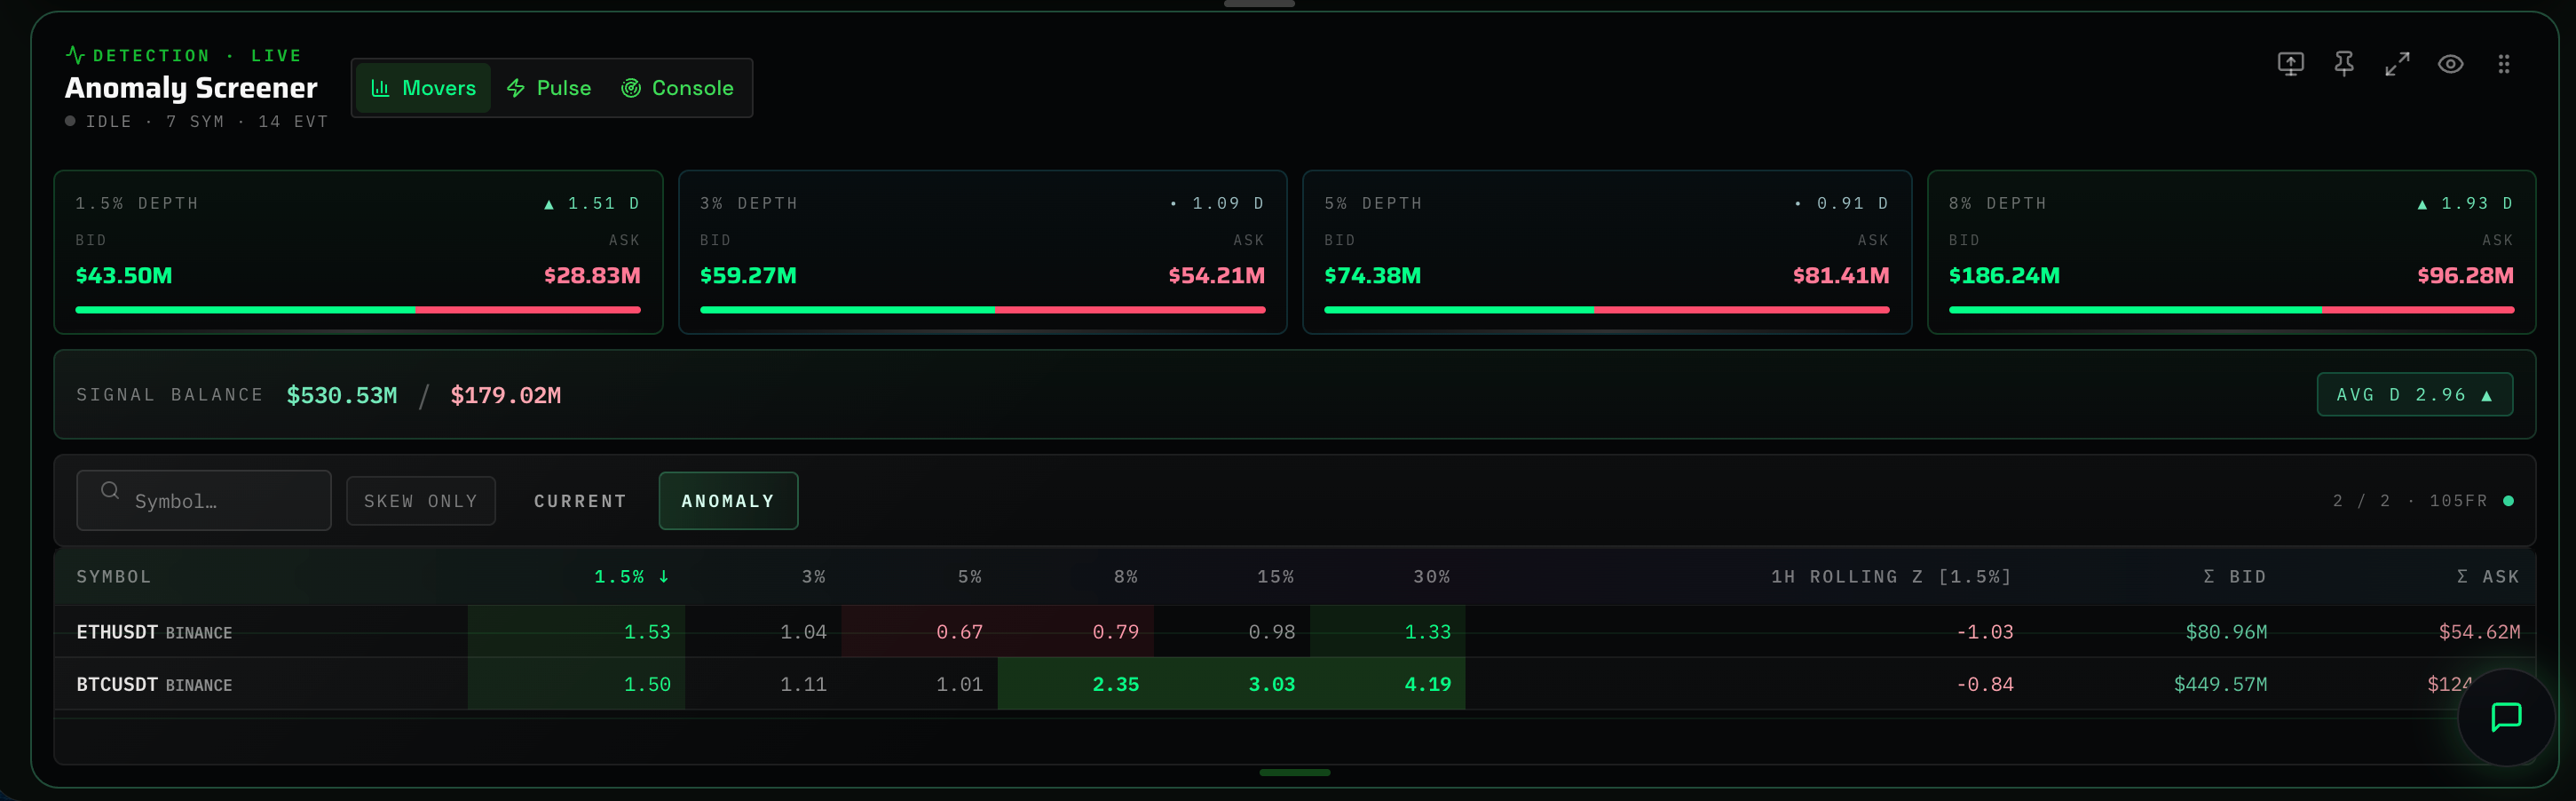
- Movers — live depth screener. Displays raw
D = bid/askper depth band and a rolling 1h Z-score anomaly layer. - Pulse — crypto-bubbles map. Displays one circle per symbol with active anomalies in the last 60 seconds. Size represents aggregate intensity; color maps to the dominant side (green
BUY, redSELL, fuchsiaCLIMAX). Labels show the base asset (BTC, notBTCUSDT). Click any bubble to filter the Console instantly. - Console — structured event log. Displays the newest events at the top (capped at 200). Features per-type styling, filter chips, and symbol search.
- Liquidity Pulse — live depth-bias scanner evaluating the current L2 book.
Severity
Each event carries a severity (low, medium, high) computed from the underlying statistic:
| Anomaly | low | medium | high |
|---|---|---|---|
| Volume Spike | ` | Z | ` 3.0 – 4.0 |
| Limit Wall | ` | OBI | ` 0.80 – 0.90 |
| Trade Climax | mult 2.0 – 3.0 | 3.0 – 5.0 | ≥ 5.0 |
| Liquidation | — (legacy) | — | mult ≥ 3.0 |
Severity determines bubble radius in Pulse and is exposed in the Console payload for filtering.
When to use it
Integrate the Anomaly Screener with chart analysis and order-book data:
- Pulse + chart — keep Pulse visible as a peripheral indicator. Expanding bubbles highlight symbols attracting unusual flow before the move registers clearly on standard charts.
- Console + alerts — use Console as an audit trail. Review the 5 seconds preceding a strategy trigger to analyze the exact sequence of aggressive flow.
- Limit Wall + Movers — verify whether an order-book imbalance is structural or statistically anomalous relative to its rolling 1-hour baseline.
Limitations
- Live ticks for
Limit WallandSpoofingonly trigger for exchanges with active order book subscriptions in the processor. - The widget acts as a passive screener; it flags statistical extremes but does not generate direct trading signals.