// Indicator Manual
Margin USD
Track Binance margin borrow and repay flows to gauge speculative leverage demand in the Spot market.
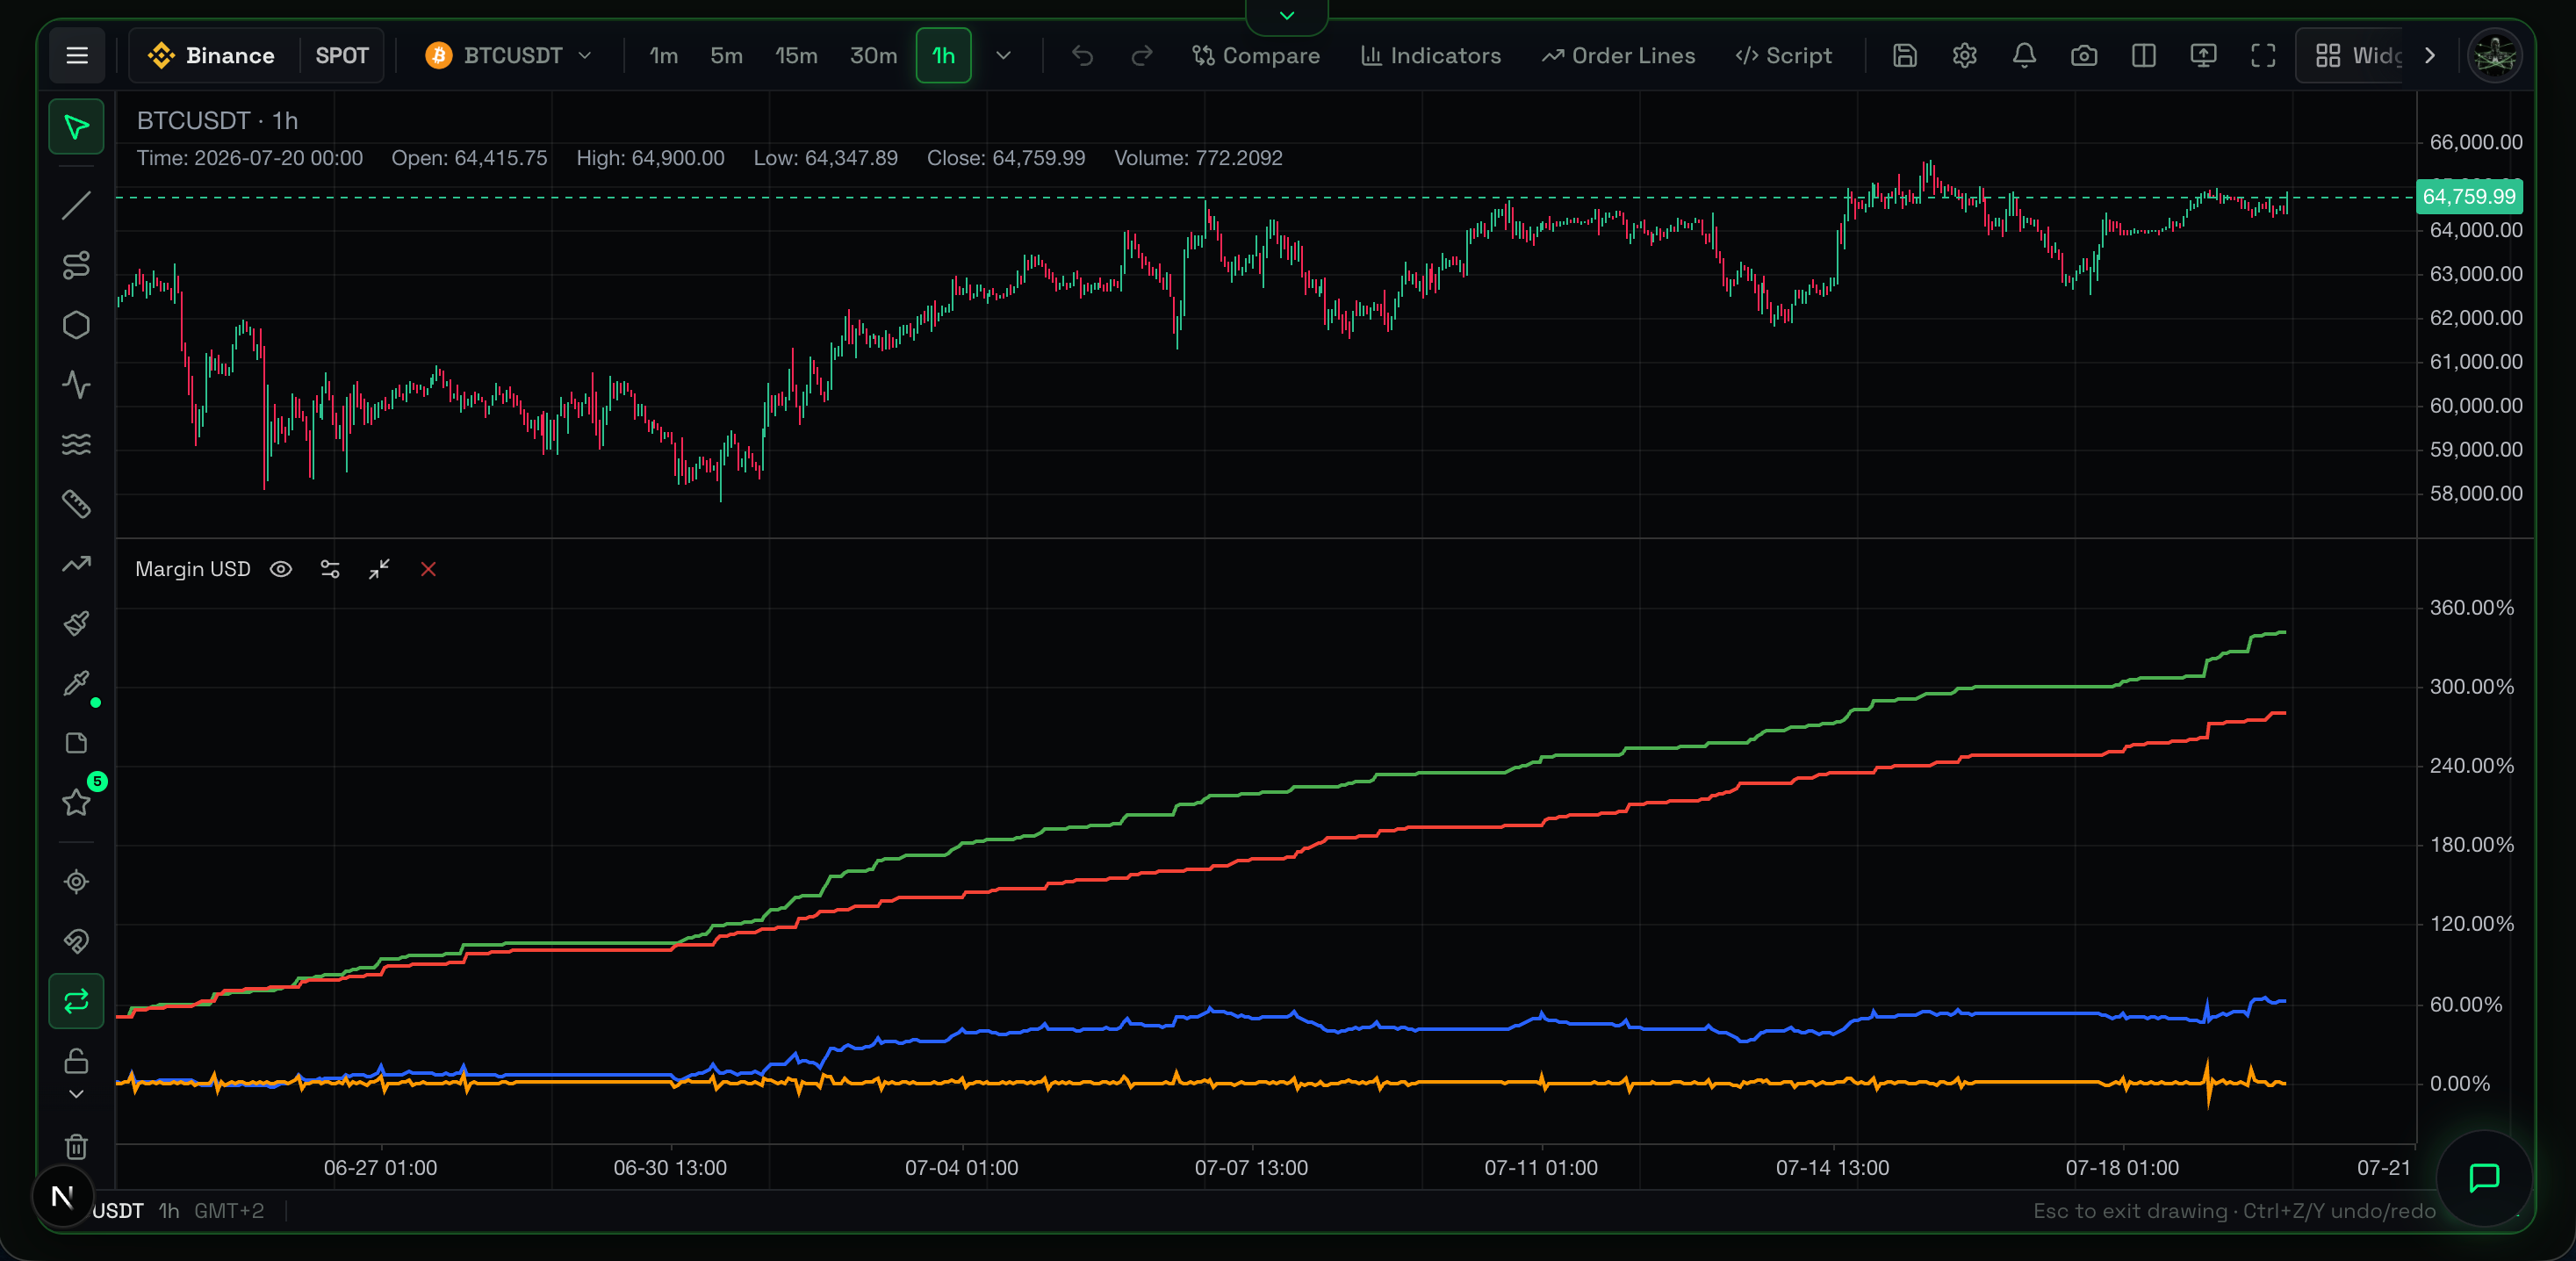
Overview
Margin USD tracks the exact amount of dollars (USDT/USD) borrowed or repaid on the Binance Spot Margin platform. By visualizing the inflow and outflow of margin loans, it provides a direct macroeconomic pulse on retail and institutional leverage appetite.
What It Shows
This indicator breaks down the margin loan cycle into four metrics:
- Borrow Vol: Volume of new margin loans taken out.
- Repay Vol: Volume of margin loans paid back to the exchange.
- Net Flow: Daily difference (
Borrow - Repay). Positive means traders take on more debt; negative means they pay it off. - Cumulative: A running total of Net Flow over time. This shows the broader trend of total margin debt in the ecosystem.
Why It Matters
When traders are highly confident prices will go up, they borrow money (margin debt) to buy more crypto than they can afford with cash. A rising Cumulative Margin Debt line means the market aggressively leverages up. If prices drop while debt is at all-time highs, traders are forced to sell their crypto to repay loans, triggering massive liquidation cascades.
How to Read It
- Rising Cumulative Debt: Bullish speculation. The market is confident and leveraging up.
- Falling Cumulative Debt: Bearish de-risking. Traders are scared and paying back loans, or are forcibly liquidated.
- Spike in Borrow Vol: A sudden rush of FOMO buying.
- Spike in Repay Vol: A sudden rush of panic selling or forced liquidations.
Practical Use Cases
- Spotting Exhaustion (Tops): If Bitcoin struggles to make new highs, but Cumulative Margin Debt skyrockets, smart money is selling bags to heavily leveraged retail traders. This divergence usually precedes a market crash.
- Confirming Healthy Trends: In a strong bull market, price and margin debt rise together steadily. Leverage fuels the uptrend.
- Identifying Bottoms (Capitulation): After a long crash, look for a massive, sudden spike in Repay Vol combined with a sharp drop in Cumulative Debt. This indicates the last remaining leveraged traders are forcibly liquidated. Once debt flushes out of the system, a true bottom forms.
Example Scenario
Bitcoin ranges between $60k and $65k for a month. During this sideways chop, Cumulative Margin Debt climbs steadily every day, hitting new all-time highs. Traders borrow millions to buy the dip, expecting a breakout to $70k. Instead, Bitcoin drops to $58k. Because the market is over-leveraged, this small drop triggers margin calls. You open a short position and ride the liquidation cascade down to $50k.
Common Mistakes
- Confusing it with Open Interest: Open Interest tracks Perpetual Futures contracts. Margin USD tracks actual dollars borrowed to buy Spot crypto. They are related but distinct concepts.
- Assuming high debt means instant crash: Markets remain irrationally over-leveraged for months. Use Margin USD to understand market vulnerability, not as a precise short trigger.
Limitations
- It only reflects Binance Spot Margin data. It does not account for loans taken on other exchanges, DeFi protocols (like Aave), or Perpetual Futures leverage.
- Borrowed funds might not deploy immediately. A trader can borrow $1M USDT and let it sit idle before buying crypto.
Related Indicators
- Open Interest: Compare Spot Margin leverage (this indicator) with Futures leverage (Open Interest).
- Liquidation Bubbles: When Margin Debt is high and suddenly falls, check Liquidation Bubbles to see forced selling in real-time.
For Advanced Users
Asset Class Context (Cross & Isolated Margin)
Unlike perpetual futures funding rates, this indicator tracks the actual borrowing and repayment of margin loans. This makes it a direct measure of systemic leverage in the Spot market, which often precedes major trend reversals.
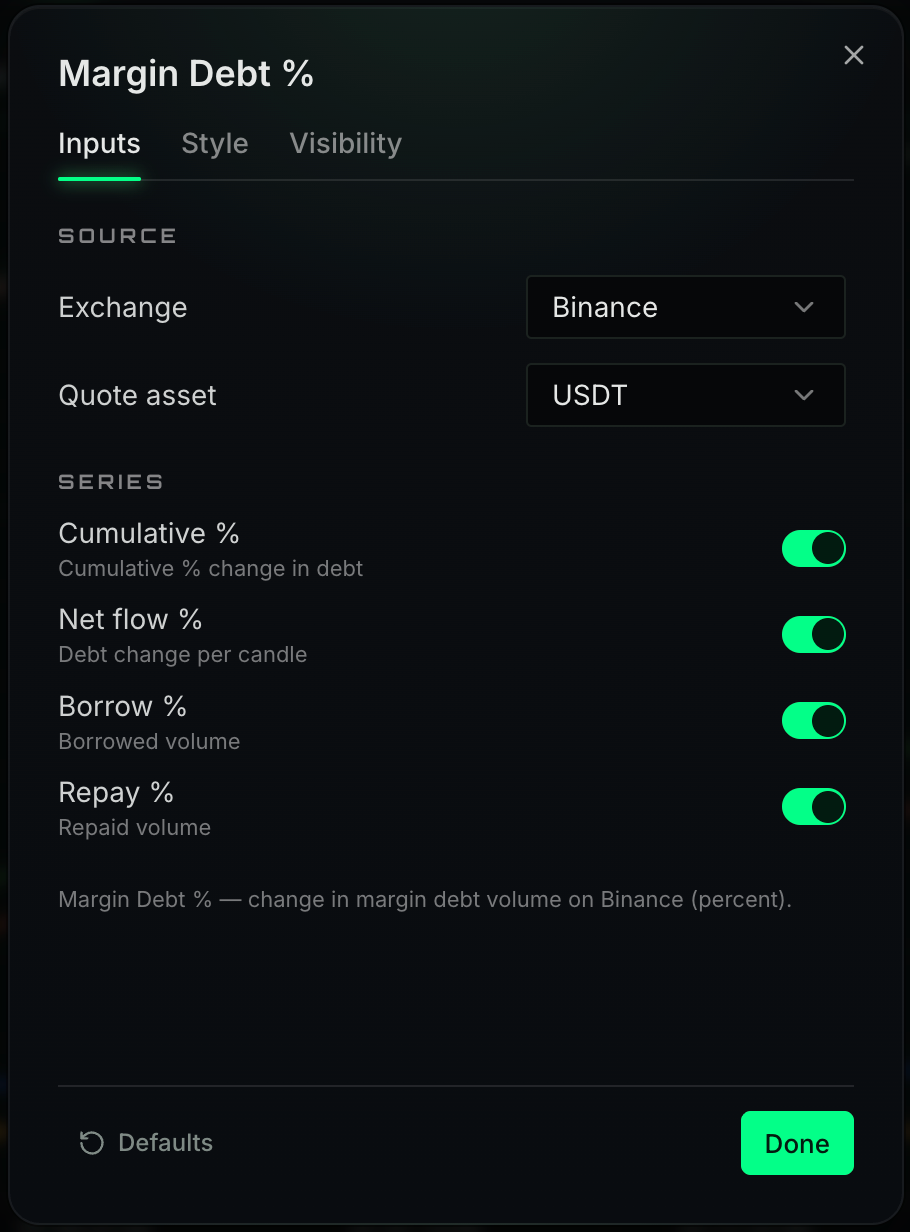
The configuration panel toggles visibility for Cumulative, Net Flow, Borrow Vol, and Repay Vol. It also toggles the data scale to display absolute USD values or relative percentage growth.