// Indicator Manual
Account Sentiment
Track long and short account positioning to identify retail crowding and one-sided participation.
Overview
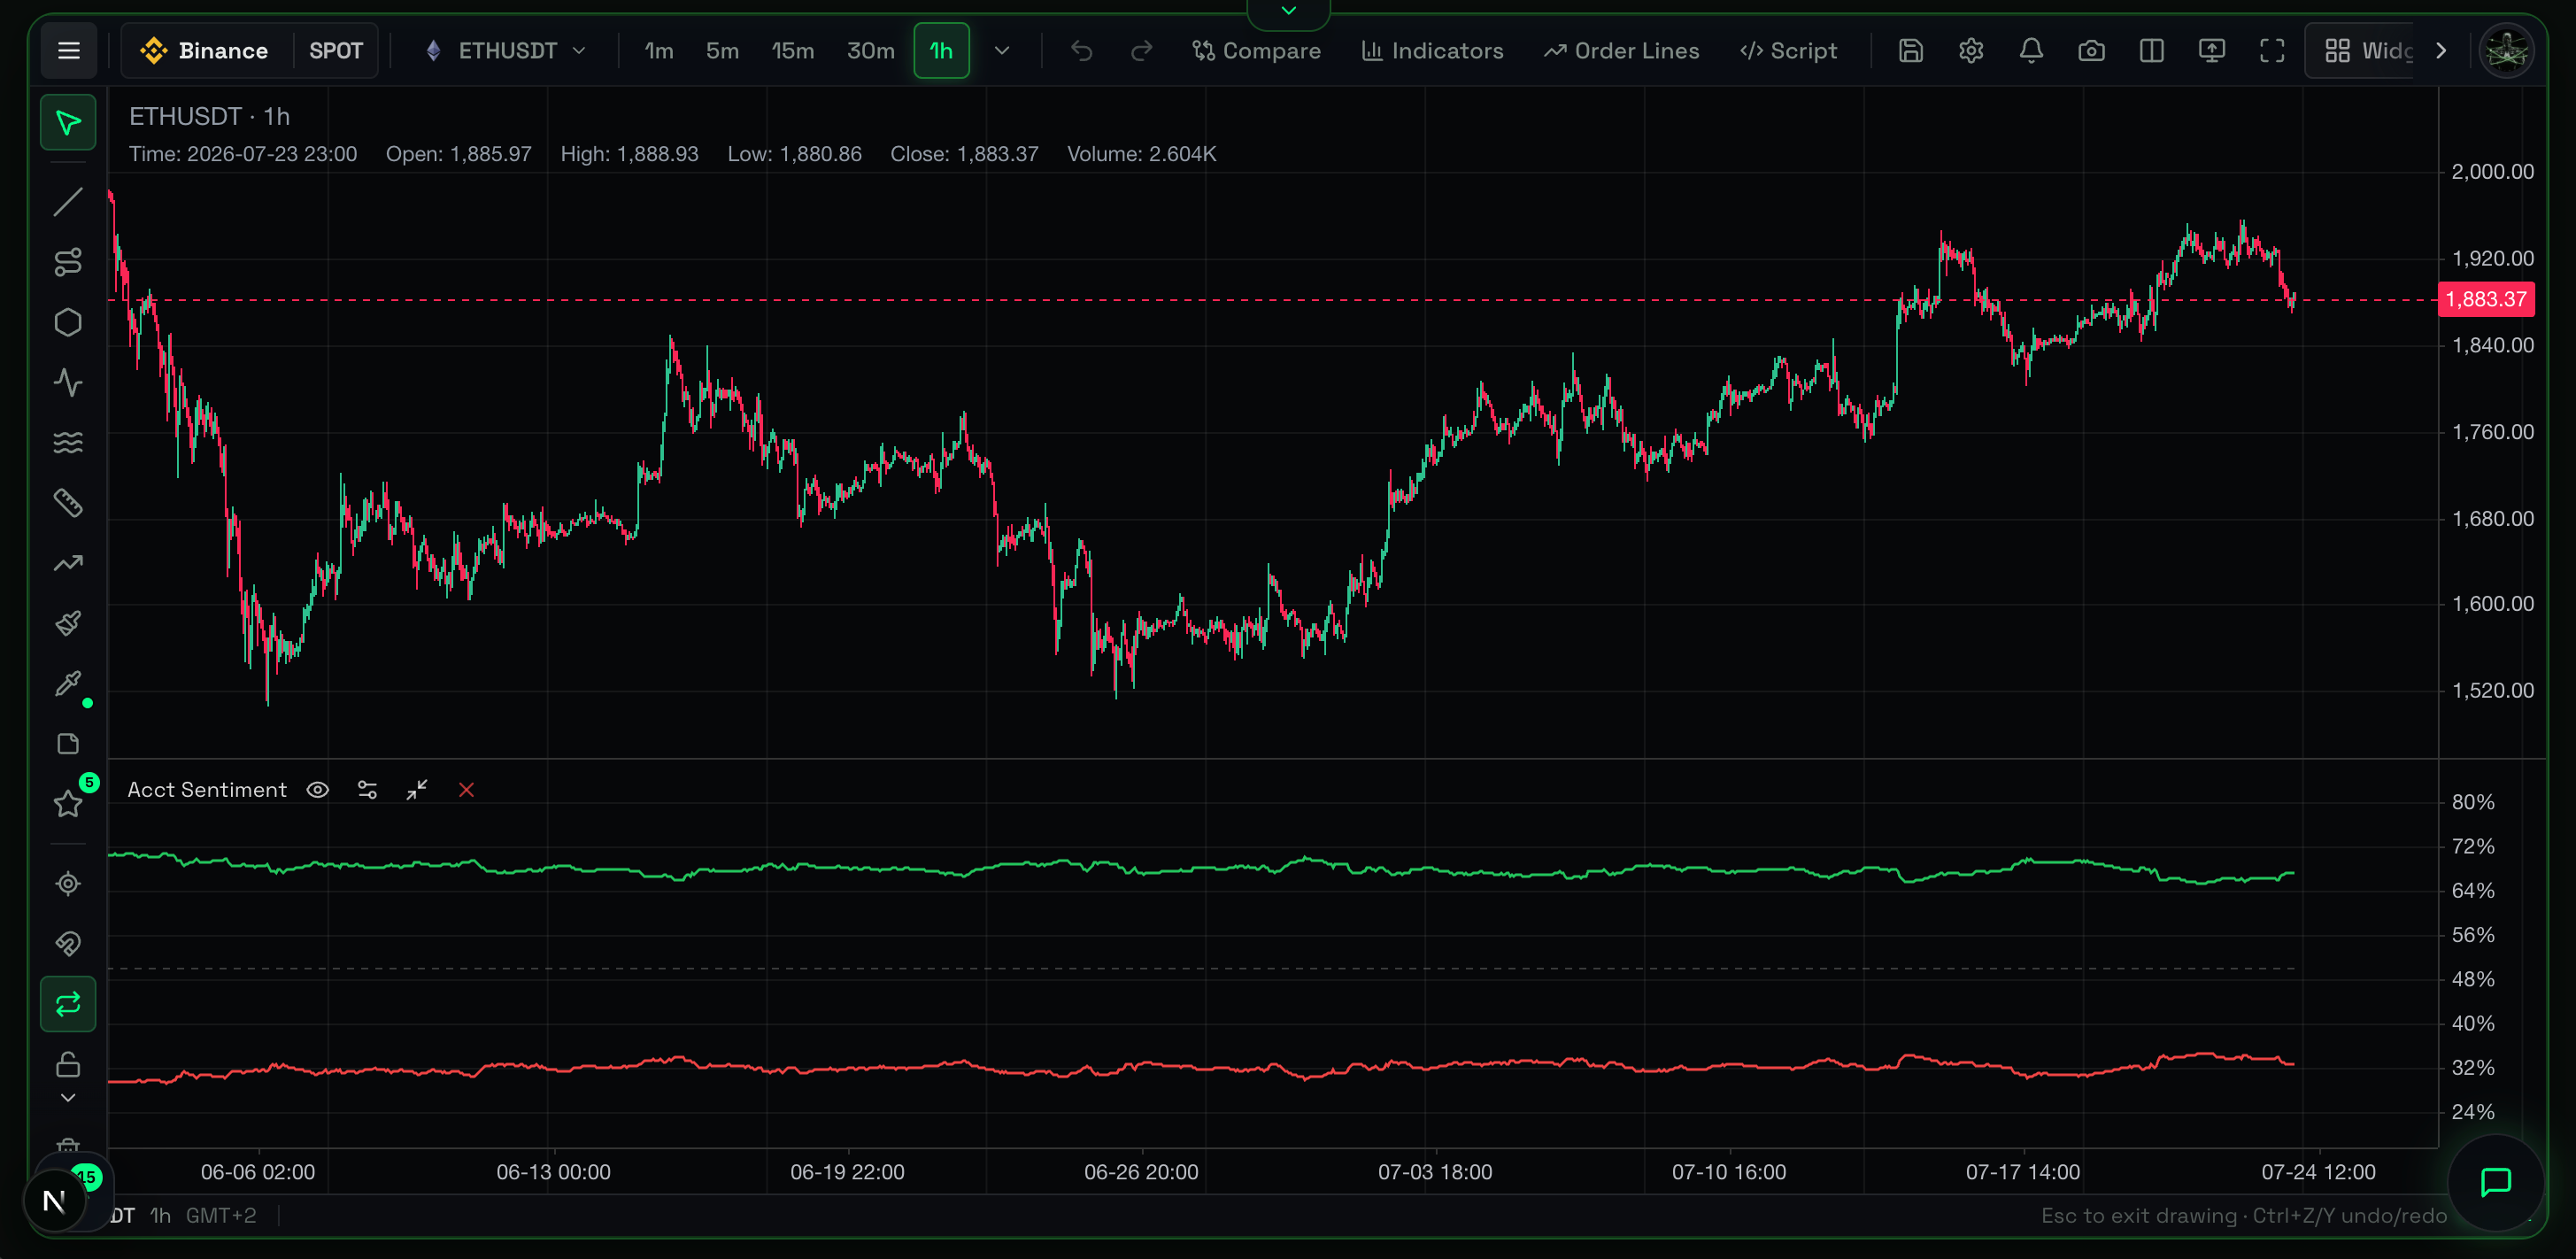
Account Sentiment tracks the proportion of unique trading accounts holding net long versus net short positions. It identifies when the retail crowd becomes heavily one-sided, signaling a potential squeeze or market trap.
What It Shows
This indicator measures the number of unique accounts, not volume. It breaks down positioning into:
- Long Account Share: Percentage of accounts betting on price going up.
- Short Account Share: Percentage of accounts betting on price going down.
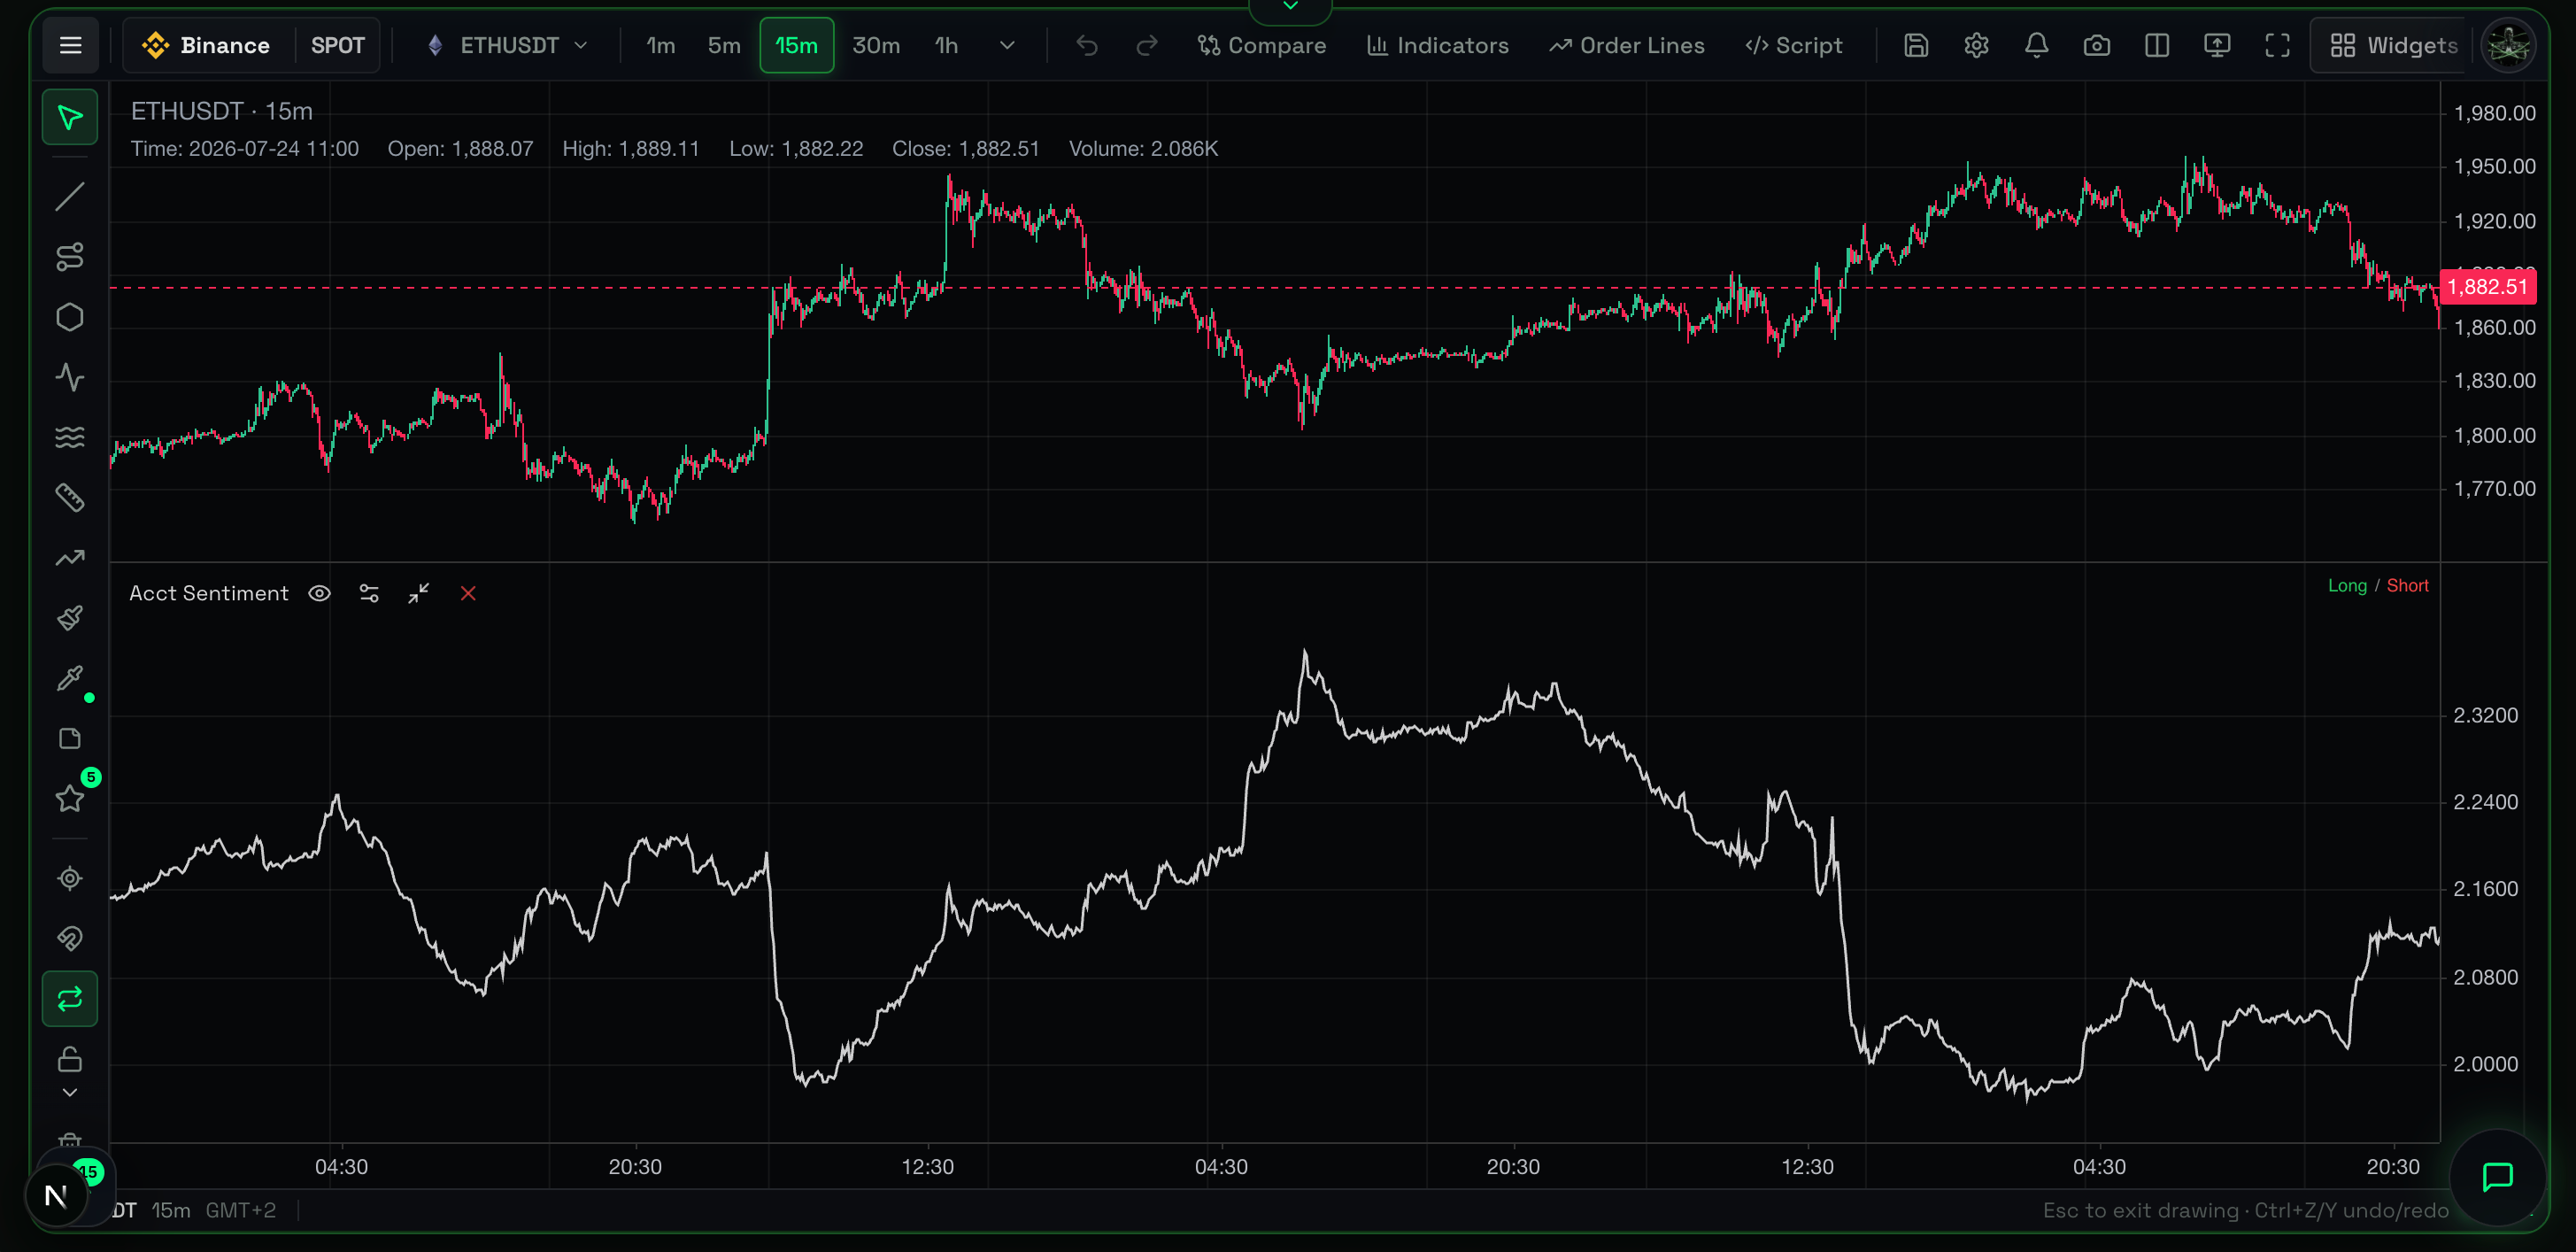
The Long/Short Ratio divides the number of long accounts by the number of short accounts.
Why It Matters
Markets rarely reward the obvious trade. When the retail crowd piles into one side, they become vulnerable liquidity for institutional players. Tracking account sentiment shows when the crowd is over-leveraged in one direction.
How to Read It
- Ratio above 1.0: More accounts are long than short (bullish crowd concentration).
- Ratio below 1.0: More accounts are short than long (bearish crowd concentration).
- Spiking Ratio during consolidation: The crowd is aggressively building positions, anticipating a breakout.
- High Ratio + Price Dropping: Retail longs are trapped and face forced liquidations.
Practical Use Cases
- Spotting Retail Traps: Extreme long positioning right before a support level breaks means trapped longs will be forced to sell, accelerating the drop.
- Contrarian Entries: When the Long/Short Ratio hits extreme historic lows, look for order-flow absorption and potential long entries to front-run a short squeeze.
- Trend Exhaustion: If price makes a new high but the Long/Short Ratio flatlines or diverges, retail participation is dropping. The trend lacks fuel.
Example Scenario
Bitcoin grinds up to a major resistance level. The Account Sentiment Long/Short Ratio spikes from 1.5 to 3.0. The crowd is aggressively entering long positions anticipating a breakout. The price fails to break resistance and turns. The crowd is heavily long. Expect a fast, violent drop as long positions hit stop-losses.
Common Mistakes
- Following the crowd blindly: A high Long/Short Ratio does not mean you should buy. The trade is crowded. Look for a reversal or squeeze.
- Ignoring whales: This indicator counts accounts, not volume. A ratio of 3.0 means retail is long, but a single whale holding a massive short position overpowers them.
Limitations
- Account positioning, not volume: It treats a $100 position the same as a $1,000,000 position.
- Delayed updates: Exchanges calculate this data as a periodic snapshot (usually every 5 minutes), not a live tick-by-tick stream.
- Extreme crowding can persist: High ratios do not force immediate reversals.
Related Indicators
- Funding Rate & Basis: Confirm if the crowded side pays a premium.
- Liquidation Heatmap: Locate the stops of the crowded positioning.
- Footprint Chart: Watch for aggressive market orders failing to push price (absorption).
For Advanced Users
Data Source & Execution Details
This data is polled directly from the exchange's internal positioning API (e.g., Binance Global Long/Short Ratio). It reflects whether an account is net long or net short across all open positions for the specific symbol. Supported API intervals range from 1m to 1d.
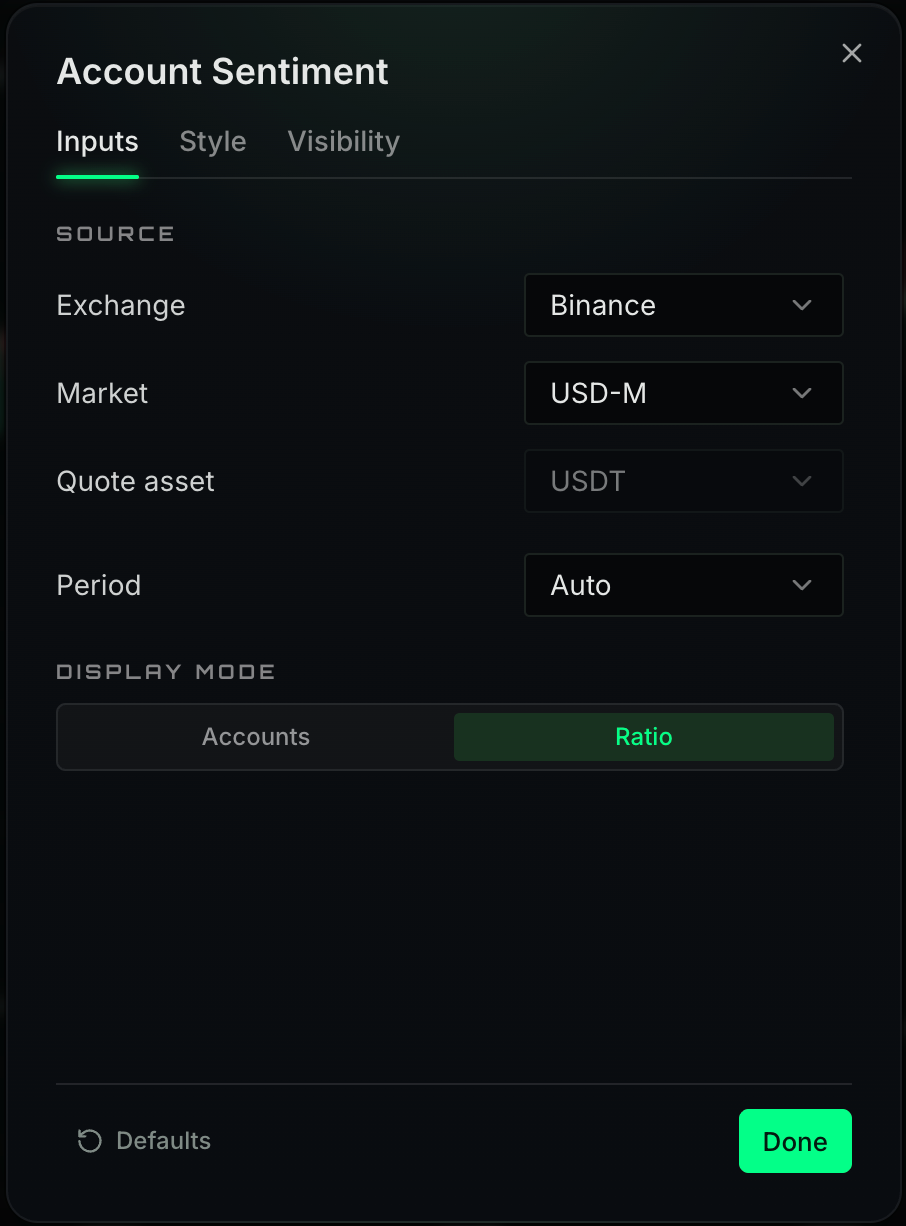
In the settings panel, you can adjust the Lookback Period, Data Source (Exchange/Market), and Ratio Thresholds for visual alerts.