// Indicator Manual
Volume Profile (VPVR)
Horizontal volume profile of the visible range—discover fair-value zones and volume nodes based on where trading actually happened.
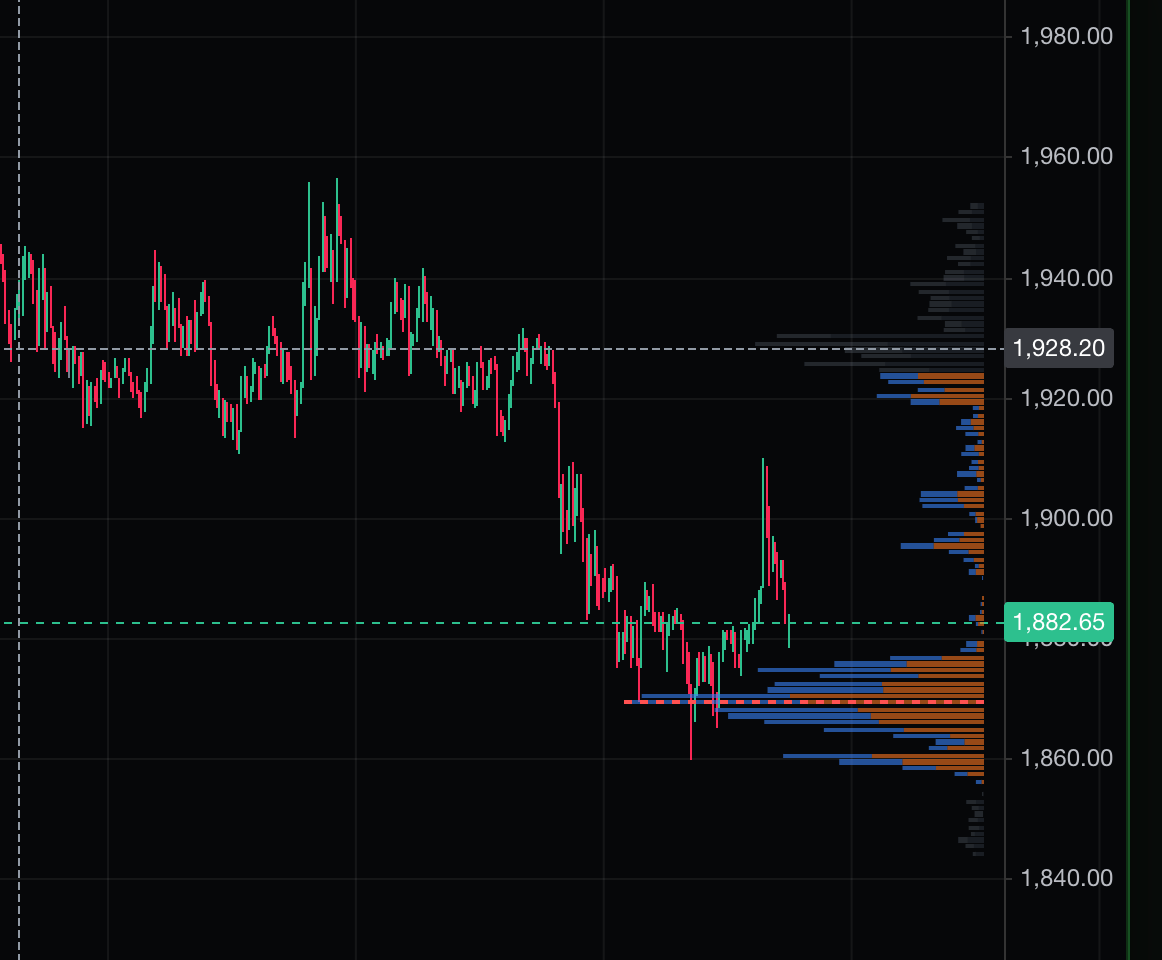
Overview
Traditional volume bars at the bottom of the chart show when trading happened. The Volume Profile Visible Range (VPVR) flips this horizontally to show at what prices trading happened. By plotting a histogram on the Y-axis, it instantly reveals the "fair value" zones where the market spent the most time and money, as well as the "vacuum" zones that price slices through quickly.
What It Shows
VPVR calculates the total volume traded at every specific price level within the current visible screen.
- POC (Point of Control): The prominent red line. This is the single price level where the most volume traded. It is the center of gravity for the current chart.
- Value Area (VA): The brightly colored section of the histogram. It highlights the price range where exactly 70% of all trading occurred.
- Tails (Dim Bars): The dim sections outside the Value Area. These represent prices that were quickly rejected (only 30% of trading happened here).
- Blue vs Orange: Inside each bar, blue represents volume executed by aggressive buyers (hitting the ask), and orange represents volume executed by aggressive sellers (hitting the bid).
Why It Matters
Markets are auction mechanisms. Price naturally gravitates toward areas where buyers and sellers agree on value (High Volume Nodes). Conversely, price rapidly moves through areas where there is no agreement (Low Volume Nodes). By knowing exactly where the market historically accepted or rejected price, you set highly accurate support/resistance levels, take-profit targets, and stop-losses.
How to Read It
- High Volume Nodes (Wide Bars): Strong support or resistance. The market considers this "fair value," so price often ranges sideways here, getting chopped up.
- Low Volume Nodes (Thin Bars / Gaps): Weak support. The market rejects these prices and travels through them very quickly.
- Price inside the Value Area: The market is balanced and ranging. Expect mean reversion back to the POC.
- Price outside the Value Area: The market is unbalanced and trending. Expect it to search for a new fair value.
Practical Use Cases
- Mean Reversion (Range Trading): If the price ranges inside the brightly colored Value Area, short the top edge (Value Area High) and long the bottom edge (Value Area Low), targeting the red POC line in the middle.
- Breakout Trading (Low Volume Nodes): If the price breaks out of the Value Area and enters a "thin" Low Volume Node, do not fade it. The price moves aggressively through this vacuum until it hits the next High Volume Node from a previous timeframe.
- Placing Stop Losses: Never place a stop loss directly inside a High Volume Node (the market naturally gravitates there, guaranteeing a stop-out). Hide stops just outside the Value Area in the thin tails, where price is likely to be rejected.
Example Scenario
Bitcoin chops sideways for three days between $60,000 and $62,000. You check the VPVR and see a massive, fat cluster of volume in that range, with the red POC line at $61,000. Suddenly, price breaks above $62,000. Looking directly above on the VPVR, you see a massive gap (a Low Volume Node) all the way up to $65,000, where another fat cluster exists. You immediately go long. Because there is no historical volume in that gap, there is no friction. Bitcoin teleports to $65,000 in two hours, right into the next High Volume Node, where you take profit.
Common Mistakes
- Forgetting it is tied to the visible screen: VPVR recalculates based on exactly what is visible on the screen. Zooming out changes the profile. Always ensure the specific price action analyzed is fully in view.
- Treating the POC as a wall: The POC is a magnet, not a wall. Price wants to trade around it. It is terrible for a stop-loss, but optimal for a take-profit target.
Limitations
- It is purely historical. It tells you where volume was, not where limit orders are resting right now.
- Panning or zooming the chart changes the profile, which confuses traders who ignore their X-axis boundaries.
Related Indicators
- Market Depth Heatmap: VPVR shows where volume already traded. The Heatmap shows where limit orders are waiting to trade.
- Footprint Chart: Zooms in to show the volume profile inside a single specific candlestick.
For Advanced Users
Tick-by-Tick Precision Calculation
Unlike standard charting platforms (like TradingView) that estimate volume profiles using lower timeframe candles (introducing massive inaccuracies), QUANTIX builds the VPVR by aggregating raw tick-by-tick trade history.
- Dynamic Range: The profile strictly recalculates based on the exact visible chart range.
- Price Bucketing (Bins): The visible price range divides into 100 vertical price levels (bins). Every executed trade maps into its corresponding bin with zero estimation error.