// Indicator Manual
Footprint
Read bid and ask traded volume inside each candle by price cluster to spot hidden market absorption.
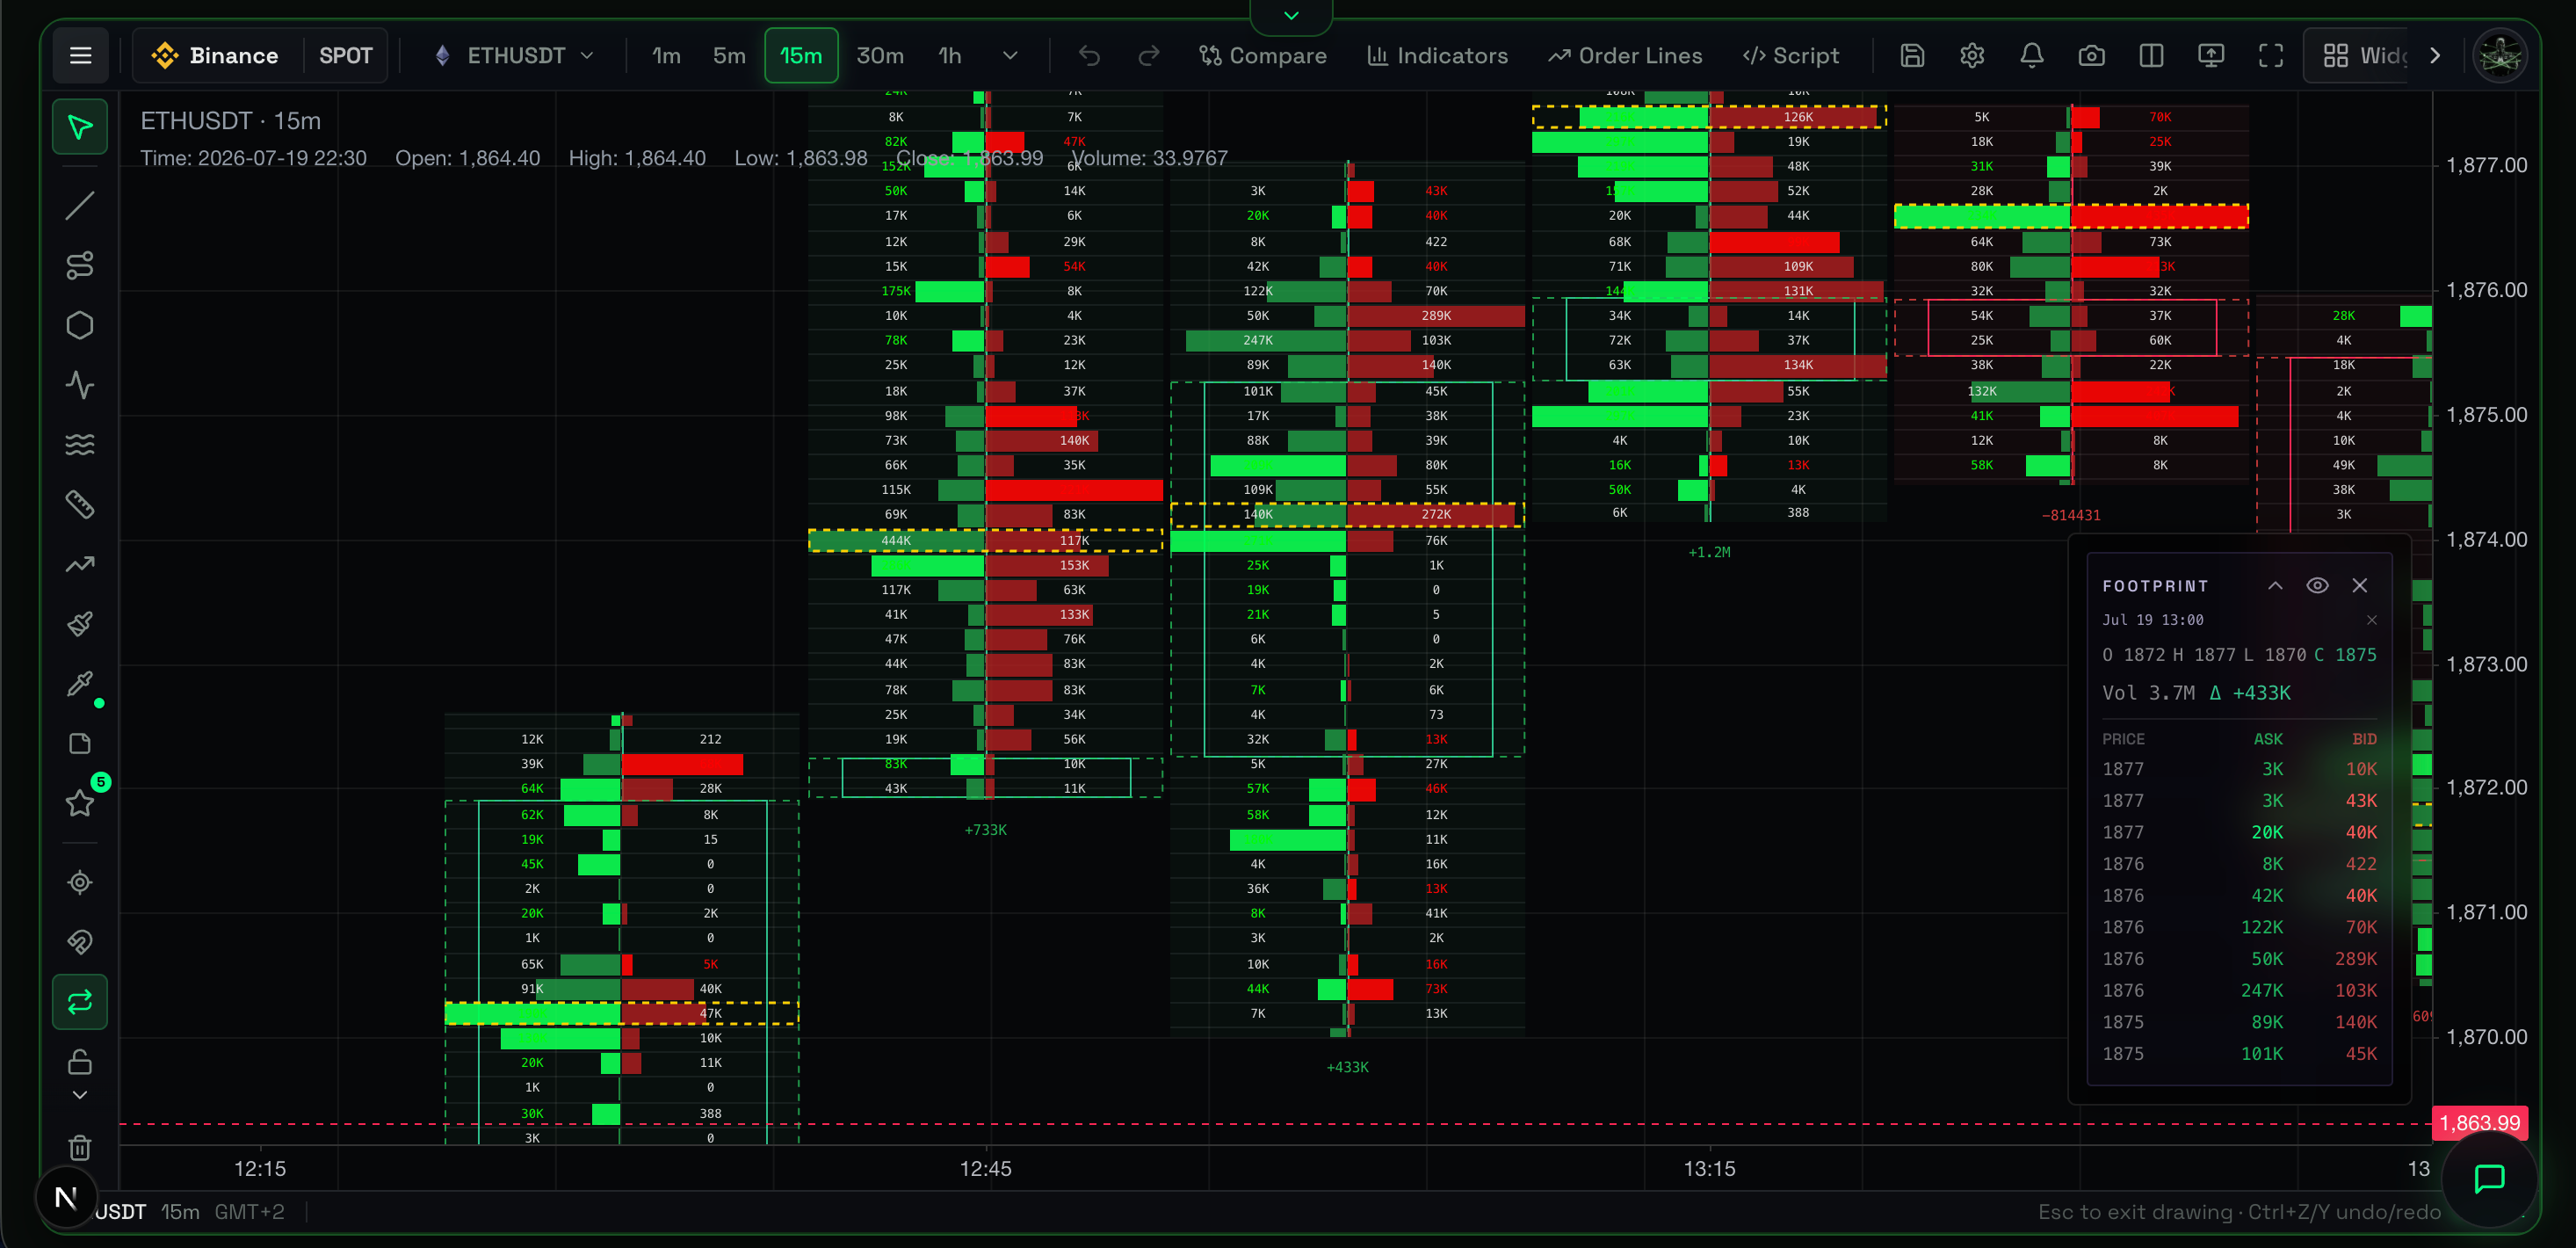
Overview
The Footprint chart operates like an X-ray for Japanese candlesticks. Instead of just showing the open, high, low, and close, it slices the candle horizontally into price clusters. It reveals exactly how much aggressive buying (market buys) and selling (market sells) executed at every single price level inside that candle.
What It Shows
Standard candles show the final result of a price battle. The Footprint chart shows the battle itself by breaking down the executed volume inside the candle:
- Left Side: Volume executed by aggressive sellers (hitting the bid).
- Right Side: Volume executed by aggressive buyers (lifting the ask).
- Color Intensity: Highlights the price levels (nodes) with the heaviest trading concentration.
Unlike Order Book or DOM tools which show resting limit orders, the Footprint chart only shows executed market orders. It records money actually changing hands.
Why It Matters
The Footprint exposes the exact moment a market maker steps in to absorb aggressive retail buying or selling. If you see massive aggressive buying volume at the top of a candle, but the price refuses to break out and the candle closes bearish, you are witnessing "absorption." Institutional limit orders absorbed the retail market buys, trapping them. This micro-detail is invisible on a standard candlestick chart.
How to Read It
- Imbalances: When one side (e.g., buyers) significantly out-volumes the other side at a specific price level, it creates an "imbalance." Stacked imbalances often act as short-term support or resistance.
- High Volume Nodes (Point of Control): The price cluster inside the candle with the most total volume. This marks where the market accepted the price.
- Thin Nodes: Price levels with very little volume. Price usually moves through these areas very quickly (low friction).
Practical Use Cases
- Spotting Exhaustion / Absorption: Look for a massive cluster of buying volume at the very top wick of a bullish candle. If the price fails to close above that cluster, passive sellers absorbed the buyers. This offers a high-probability short entry.
- Confirming Breakouts: A true breakout features strong, continuous buying imbalances pushing through resistance, leaving a trail of high-volume acceptance. Breakouts on thin volume are likely fakeouts.
- Validating Support: When price drops into a key support level, watch for heavy selling volume on the Footprint that fails to push the price lower, immediately followed by strong buying imbalances.
Example Scenario
Bitcoin spikes into a major resistance level of $70,000. On a normal chart, a green candle touches the line. On the Footprint, you see 500 BTC of aggressive market buys at $69,990, yet the candle closes at $69,950. Someone placed a massive passive sell wall at $70k that absorbed the buyers. The trapped buyers will soon panic and sell. You confidently enter a short trade.
Common Mistakes
- Information Overload: Staring at every number inside every candle causes paralysis. Focus on extremes: massive volume clusters, heavy imbalances, and the candle close relative to those clusters.
- Ignoring Context: A buying imbalance in the middle of a random trading range means nothing. A buying imbalance rejected at a major daily resistance level means everything.
Limitations
- Requires Volatility: Footprint charts are noisy and hard to read in slow, sideways, low-volume markets.
- Microstructure Focus: It is a zoomed-in, micro-execution tool, unsuitable for macro trend analysis.
Related Indicators
- CVD (Cumulative Volume Delta): Provides the macro view of the aggressive buying/selling shown by the Footprint.
- Liquidity Depth: Shows the passive limit orders that the Footprint market orders crash into.
For Advanced Users
Asset Class Context
Order-flow aggression is best read where the highest leverage and volume exist. The Footprint chart automatically displays executed volume from the Futures market, even if your main chart views a Spot pair.