// Indicator Manual
Liquidity Depth
Read order-book depth by level, bid/ask delta, bid/ask ratio, and order flow imbalance (Flow) across distance bands.
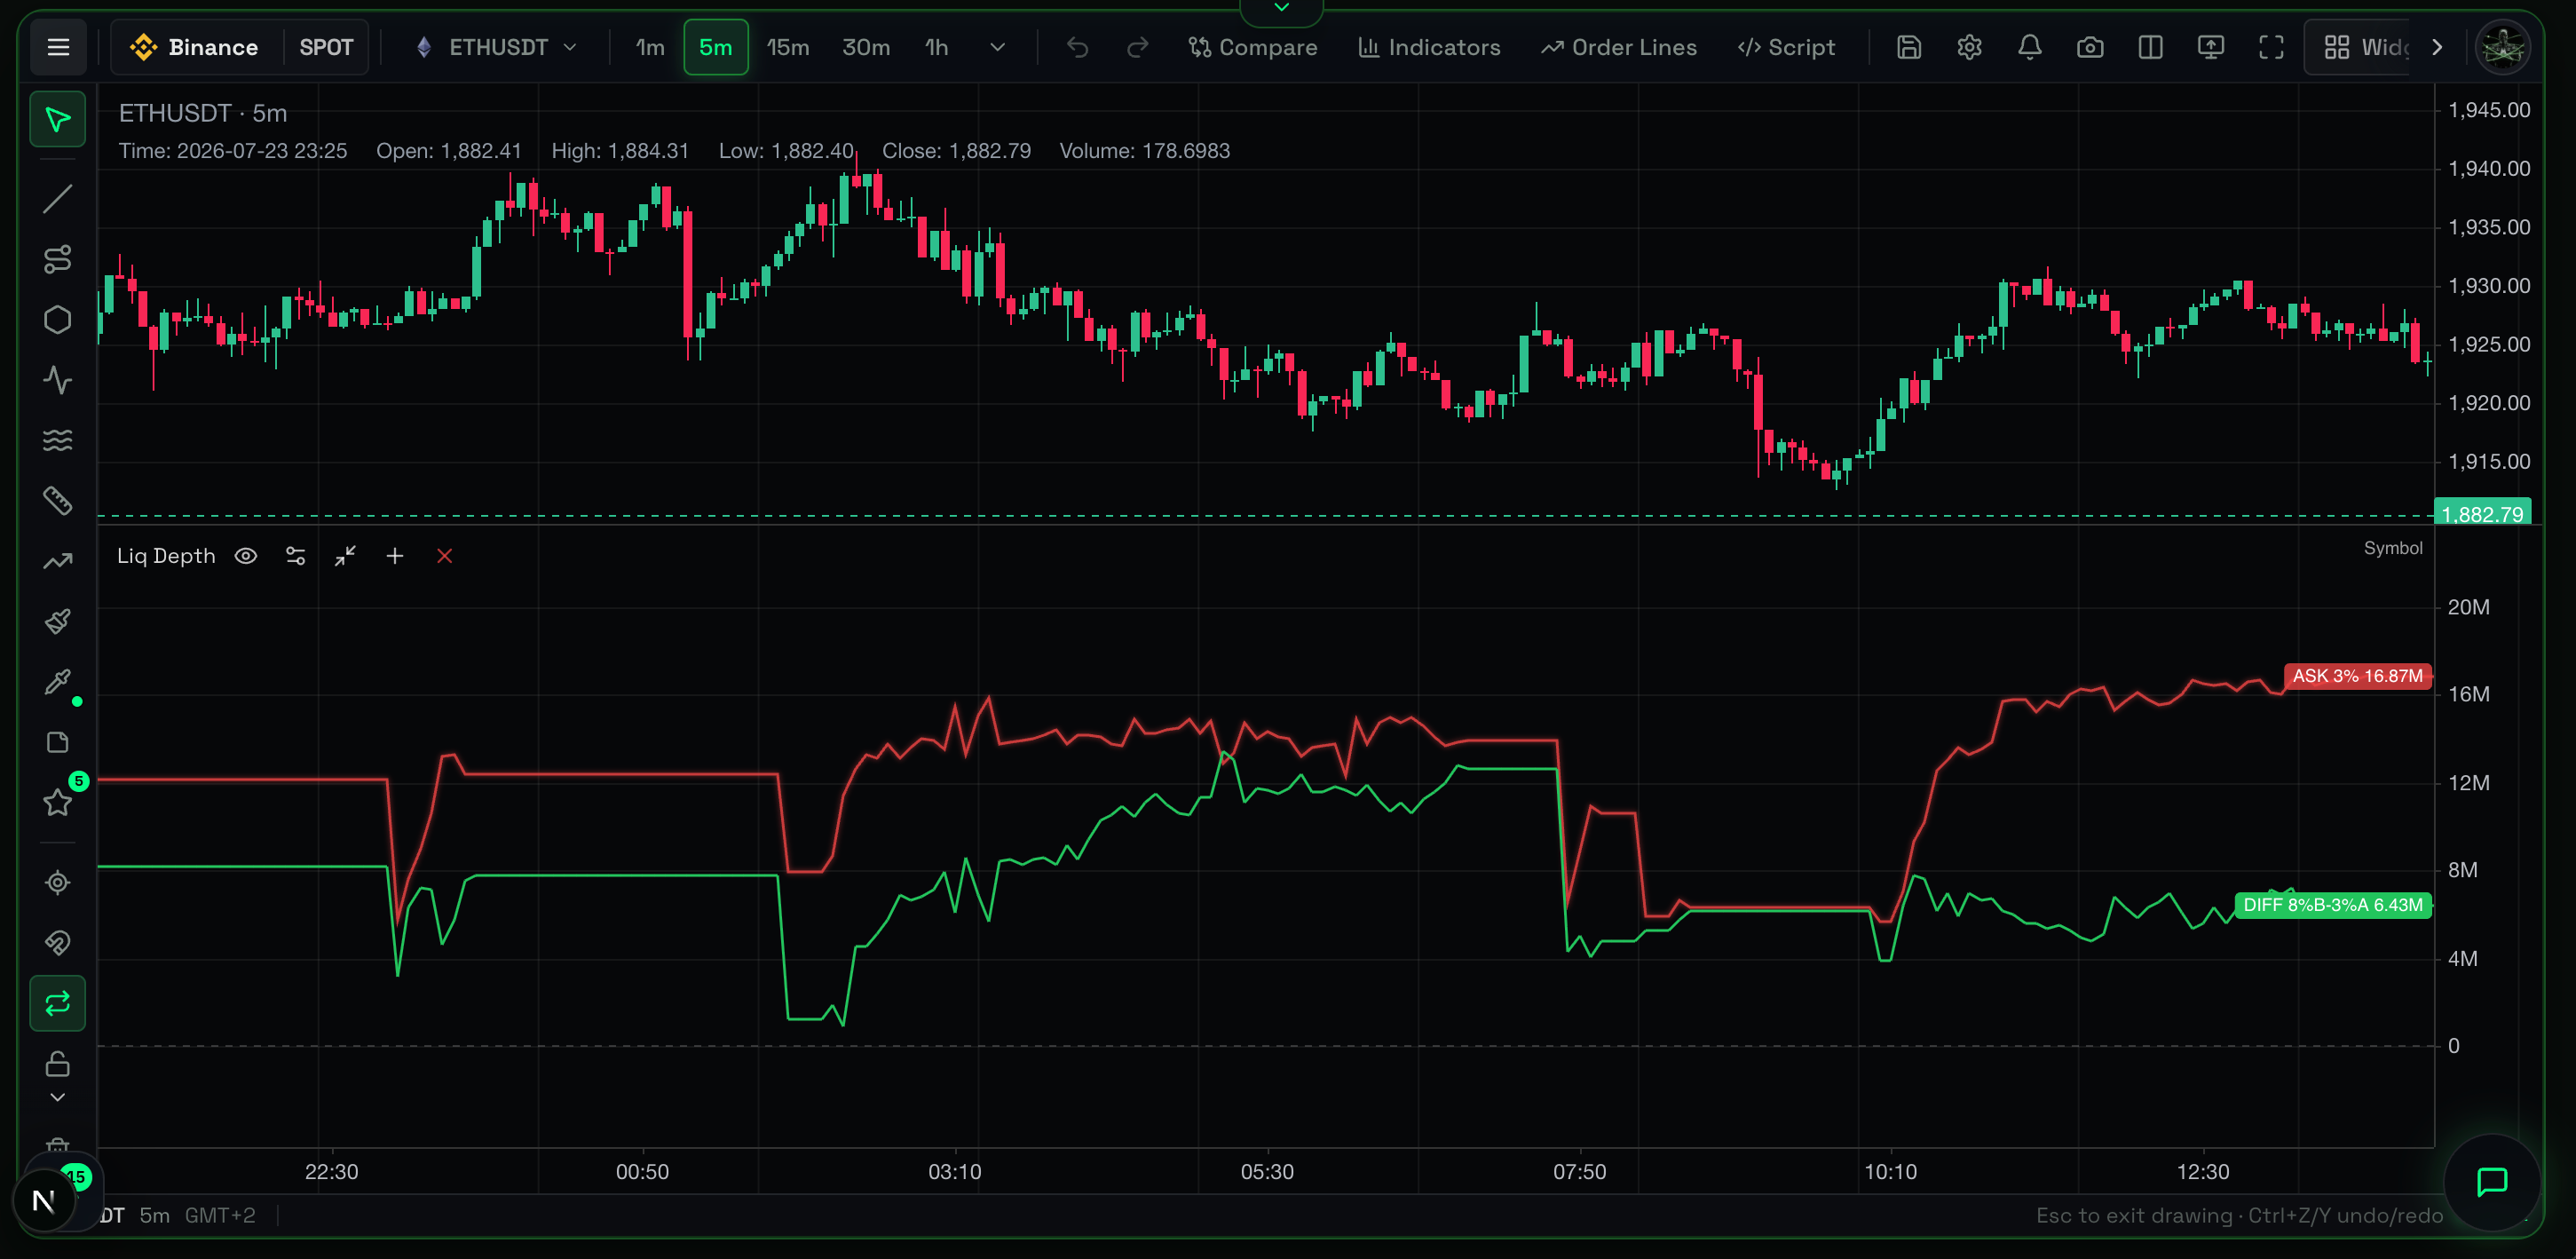
Overview
Liquidity Depth reveals the hidden intentions of market makers. Instead of waiting for historical trades to print, it shows where massive limit buy and sell orders are resting in the market before the price reaches them.
What It Shows
This indicator breaks the order book down into different visual modes and distance bands (how far the orders are placed from current price, e.g., 1.5%, 5%, 30%). It tracks four core metrics:
- Levels: Absolute volume of resting limit orders for buying (Bids) and selling (Asks).
- Delta: Absolute volume difference (
Bids - Asks). Green means bid dominance; red means ask dominance. - Ratio: Proportional difference (
Bids / Asks). A ratio of 1.5 means 50% more bid volume than ask volume. This tab has a Scale switch — see Imbalance below. - Flow (Order Flow Imbalance): The net rate of change in limit orders. It shows if orders are actively added or canceled over time.
Why It Matters
Institutional players cannot use market orders to enter massive positions due to slippage. They use limit orders. By tracking the depth and flow of these limit orders across different distance bands, you spot where whales build support walls, place resistance targets, and try to trick retail traders.
How to Read It
- Huge Bid column (Levels): A wall of support below the price.
- Huge Ask column (Levels): A wall of resistance above the price.
- Delta > 0 (Green): Buyers outnumber sellers in the selected distance band.
- Rising Flow: New buy orders are aggressively added to the book, or sell orders are canceled. A strong sign of hidden accumulation.
- Falling Flow: New sell orders are stacked, or buy support is pulled. A sign of hidden distribution.
Practical Use Cases
- Spotting Breakouts: If price approaches a strong resistance level and the Flow indicator rises aggressively, resistance limit orders are pulled and buy pressure steps in. A breakout is highly probable.
- Finding Liquidity Vacuums: If the Levels tab shows a sudden drop in both Bid and Ask volumes, the order book is empty. Price slices through these "vacuums" in seconds because there is zero friction. Prepare for high volatility.
- Macro Target Finding: Switch to the 30% wide band. Large funds place their macro targets and safety nets here. Use these massive distant walls to plan long-term swing exits.
Example Scenario
You see a massive green wall of bids right below the current price on the Levels tab. It looks like impenetrable support. You decide to go long. However, if you had looked at the Flow tab, you would notice the line sharply falling as price approached the wall. The wall was actually "melting"—the market maker quietly canceled bids as the price got closer (spoofing). Moments later, the wall vanishes entirely. The price crashes straight down through your stop-loss.
Common Mistakes
- Treating Limit Orders as Guarantees: Limit orders are intentions, not executed trades. They are canceled in milliseconds (spoofing). Never trust a massive wall blindly.
- Ignoring Flow: Looking only at static Levels without watching Flow is dangerous. Flow tells you the momentum of the limit orders—whether the wall builds up or melts away.
Limitations
- Spoofing: Market makers frequently place fake orders to manipulate retail sentiment.
- Iceberg Orders: Large players hide their true volume by slowly feeding it into the book. This indicator only sees what visibly rests on the book.
- Requires Execution Confirmation: Always confirm that aggressive market orders (CVD / Footprint) actually interact with these passive walls.
Related Indicators
- CVD (Cumulative Volume Delta): Compare passive limit order intentions (Liquidity Depth) with aggressive market order execution (CVD).
- Market Depth Heatmap: A visual, time-based representation of the exact same limit order data.
For Advanced Users
Distance Bands & Market-Wide Mode
Instead of looking at the entire order book as a single blob, the calculation filters it by distance from the spot price (e.g., 1.5%, 30%). Close bands (1.5%) are dominated by high-frequency algo-bots and are useful for scalping. Wide bands (30%) reveal macro-structural support.
Additionally, this indicator can aggregate data across the entire crypto market (Market-wide mode) to gauge the total global macro order book temperature.
Ratio vs Imbalance
The Ratio tab has a Scale switch. Ratio is the raw multiple Bids / Asks (balanced = 1.0). Imbalance normalizes it:
Balanced book reads 0, twice the bids +33, twice the asks −33, an emptied ask side +100. It is the same information as the ratio on a different scale, but bounded and symmetric around zero, so a level means the same thing on BTC and on a thin altcoin — unlike Delta, which is raw USD and scales with the size of the book. It also stays defined where the ratio breaks: an empty side is ±100 instead of a division by zero.
The scale is a mode, not an extra line — one pane shows one of the two. To watch both at once, add a second Liquidity Depth pane and set the other scale there.
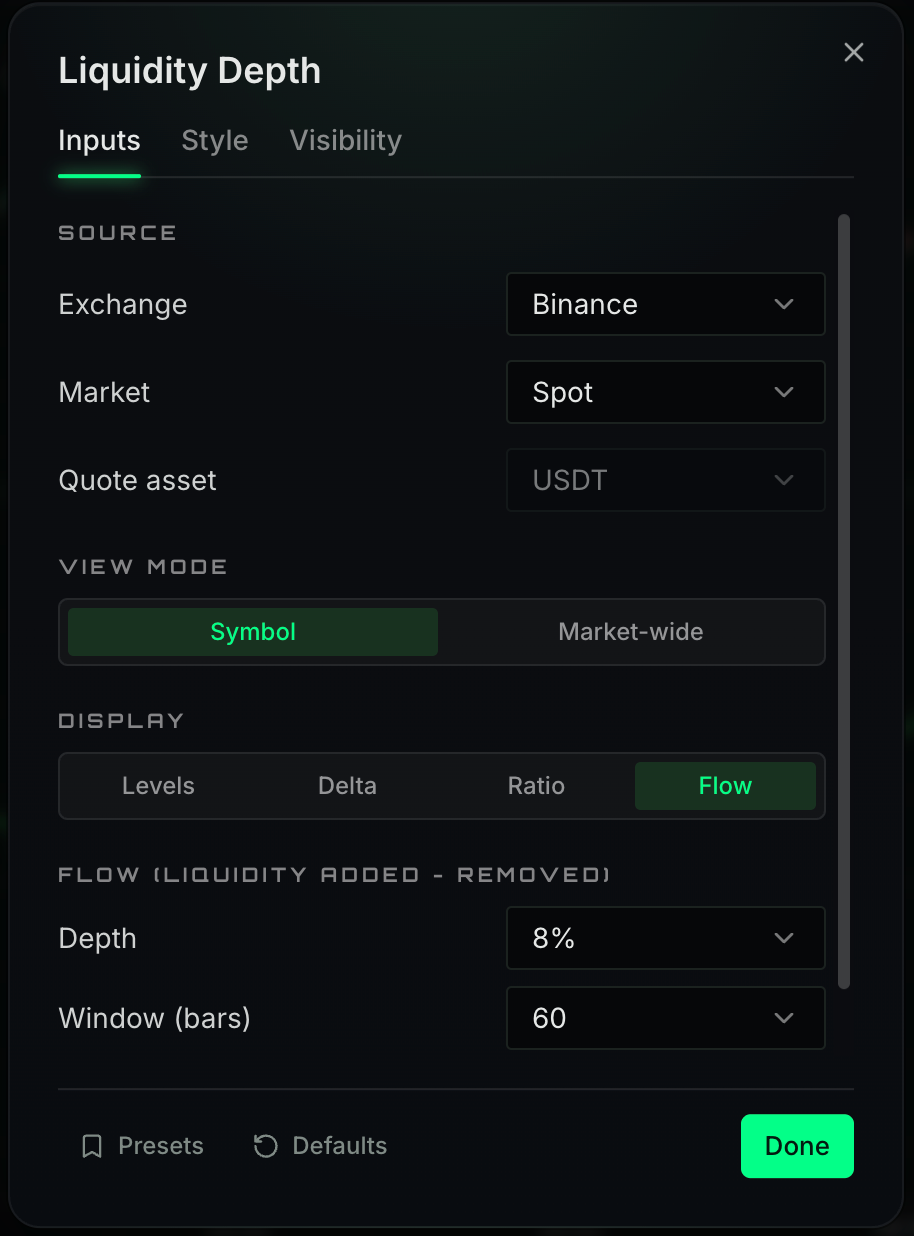
The settings panel allows you to toggle between the different visualization modes (Delta, Flow, Levels, Ratio) and adjust the depth sensitivity and thresholds.