// Indicator Manual
Trading Indicators
Master the QUANTIX order-flow, liquidity, and derivatives tools to read market structure and execution context.
Indicator Manuals
Read the Market Structure.
Technical documentation for QUANTIX order-flow, liquidity, positioning, and market-structure indicators. Understand what each tool measures and how to apply it.
Market Context over Signals
QUANTIX indicators do not print buy or sell arrows. They expose the underlying mechanics of the market—aggressive flow, passive liquidity, and crowd positioning—so you can build your own high-conviction trade ideas.
Indicator families
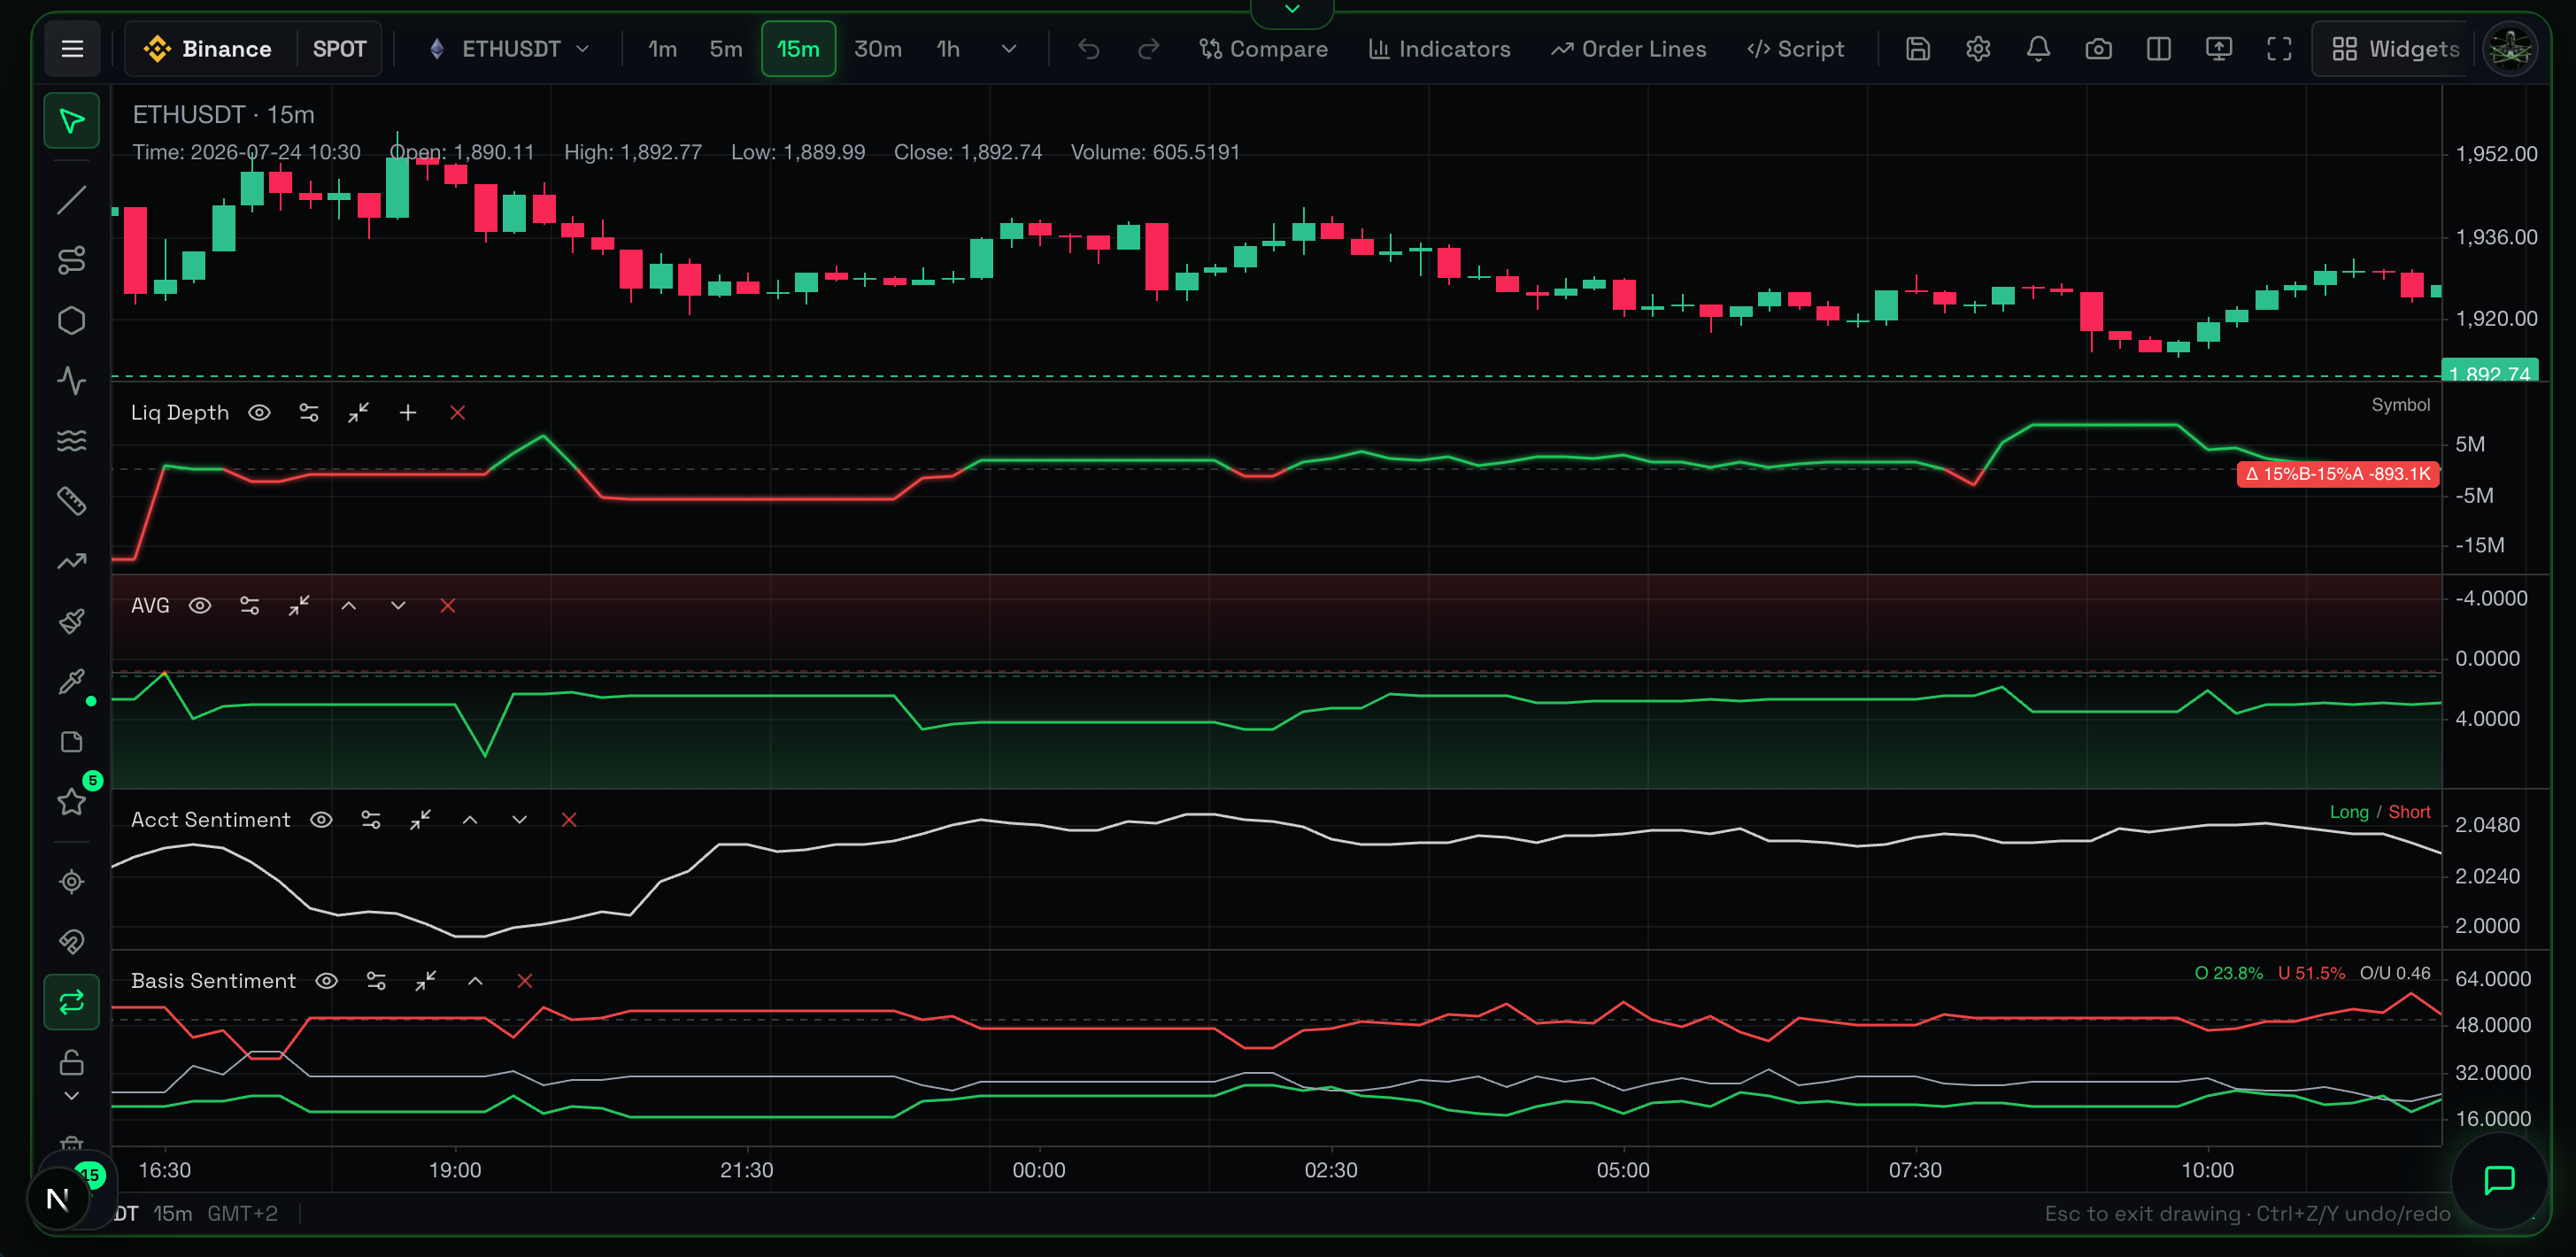
The toolset is organized around the core pillars of market microstructure:
Order Flow
See inside the candle. CVD and Footprint charts reveal whether aggressive buyers or sellers are driving the move, or getting absorbed.
Liquidity & DOM
Map the battlefield. Depth heatmaps and DOM profiles expose passive limit orders, showing where price is likely to stall or accelerate.
Derivatives Context
Track the crowd. Monitor liquidations, funding rates, and account positioning to spot over-leveraged zones ripe for a squeeze.
Market Breadth
Read the macro picture. Aggregated bid/ask ratios and global flow metrics help gauge the broader market pressure across the ecosystem.
Manuals
- Account Sentiment
- Average Bid/Ask Ratio
- Basis Sentiment
- Correlation Overlay
- Footprint
- Liquidation Bubbles
- Liquidation Heatmap
- Liquidity Depth
- Margin USD
- Market Depth Heatmap
- Volume Profile (VPVR)
Reading discipline
A professional trader doesn't use every tool at once. A clean workflow starts with a thesis on price, followed by choosing the smallest set of tools to confirm or invalidate it.
- Start with Price & Structure: Establish your bias and key levels.
- Consult Liquidity (Passive): Look at the DOM and Heatmaps to see where the limit orders are waiting.
- Confirm with Order Flow (Aggressive): Use Footprint and CVD to verify if market participants are aggressively hitting those levels.