// Indicator Manual
Average Bid/Ask Ratio
Read the market-wide ratio between bid liquidity and ask liquidity across the tracked book.
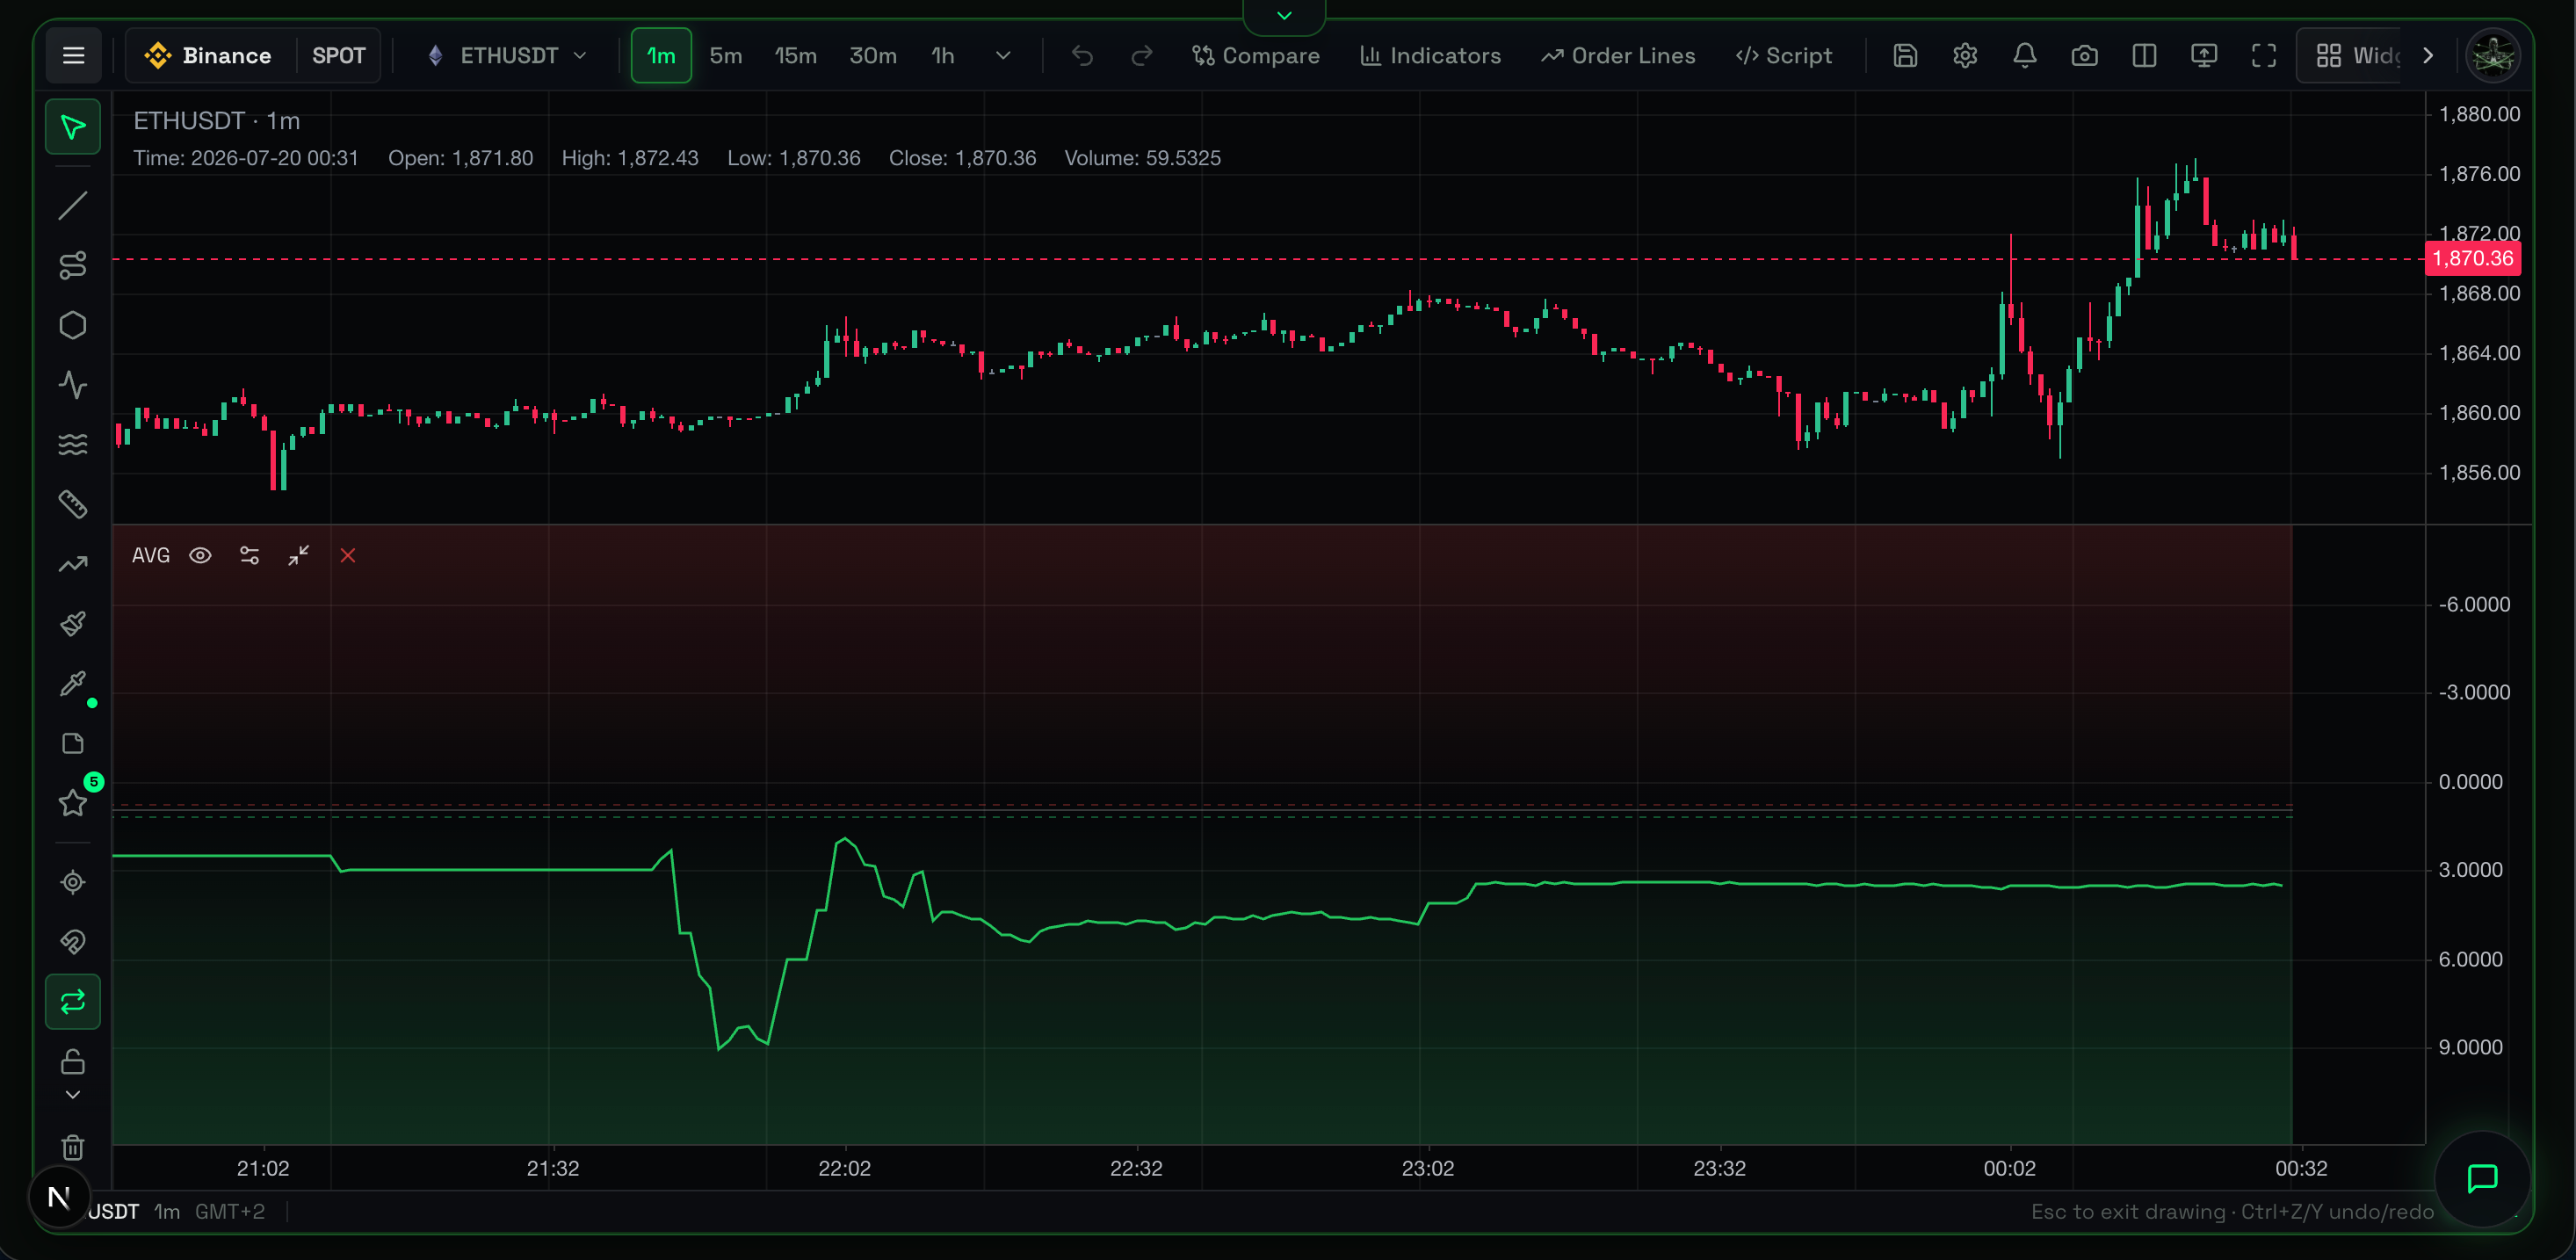
Overview
The Average Bid/Ask Ratio (AVG) tracks the balance of passive liquidity resting in the order book. It gauges whether market maker sentiment leans toward supporting the price (bids) or suppressing it (asks).
What It Shows
This indicator scans the Level-2 order book and calculates:
It measures resting limit orders waiting to be filled.
- Green Fill: The bid side has more resting volume than the ask side.
- Red Fill: The ask side has more resting volume than the bid side.
Why It Matters
Price cannot move freely through thick liquidity. If the market attempts a rally but the order book is stacked with asks (ratio < 1.0), the rally faces resistance and stalls. A thick bid side (ratio > 1.0) provides a cushion, making downward pushes harder.
How to Read It
- Ratio above 1.0: Bid side is heavier. The book is supportive.
- Ratio below 1.0: Ask side is heavier. The book is resistive.
- Rising Ratio: Bids are added or asks are pulled (bullish pressure).
- Falling Ratio: Asks are added or bids are pulled (bearish pressure).
Practical Use Cases
- Trend Confirmation: Rising price plus rising AVG ratio means market makers are actively moving bids up to support the trend.
- Spotting Exhaustion: Rising price plus dropping AVG ratio (asks piling up) means the move is hitting liquidity walls and may reverse.
- Breakout Validation: Check the AVG ratio before a breakout trade. Breakouts into thin ask sides (high ratio) succeed more often than breakouts into thick ask sides (low ratio).
Example Scenario
Bitcoin approaches a resistance level of $70,000. The Average Bid/Ask Ratio drops sharply from 1.2 to 0.6. Market makers are stacking ask limit orders at $70,000 to absorb buyers. This passive resistance signals a take-profit opportunity on longs rather than a breakout entry.
Common Mistakes
- Confusing it with Order Flow: AVG measures passive limit orders, not executed market orders. It shows walls, not attackers.
- Trading solely on the ratio: Aggressive sellers can chew through a high ratio (thick bids). Combine AVG with aggressive order flow (CVD).
Limitations
- Spoofing: Limit orders can be canceled instantly. Thick bid sides vanish if market makers pull liquidity.
- Broad, market-wide metric, not a precision timing tool.
- Works best combined with
Liquidity DepthandMarket Depth Heatmap.
Related Indicators
- Market Depth Heatmap: Visual representation of resting bids and asks.
- CVD (Cumulative Volume Delta): Shows aggressive market orders interacting with passive liquidity.
For Advanced Users
Calculation Logic & Settings
This ratio aggregates active limit orders resting in the order book.
- Depth Range: Measures liquidity within a percentage of the current price.
Totalis the widest band the platform tracks (currently±50%) and captures broader structural liquidity, not just the micro-spread. - Asset Class: Defaults to the Spot order book, even if the main chart tracks Futures, because true asset warehousing happens in Spot.
Depth Levels
AVG plots one line per depth band, so you can compare near-price liquidity against structural liquidity in a single pane. Use + Add level in the settings to add up to 8 lines from the ladder:
The same ladder as the Liquidity Depth indicator, so both can be read level for level. A narrow band (1.5–5%) reacts to what market makers park right around price; Total shows the structural book. When they diverge — say the 1.5% ratio collapses while Total holds — sellers are stacking close to price without changing the broader picture.
Two lines can drift apart only if the data exists for both: a band starts filling in from the moment the platform begins recording it, so a freshly added level builds its history going forward.
Coloring follows the number of lines. A single line is drawn with the automatic red→yellow→green ratio gradient — its shape carries the reading on its own. Add a second level and every line switches to its own solid color, editable on the Style tab; the same gradient repeated across bands would make them impossible to tell apart. Remove the extra levels and the gradient comes back.
The Overbought / oversold zones (Style tab) follow the same idea: their 1.2 / 0.8 thresholds are calibrated for a single band, so they are on for one line and off once several levels are plotted, leaving just the neutral 1.0 baseline. It is a normal checkbox — turn them back on at any time if you read the bands against the fixed thresholds.
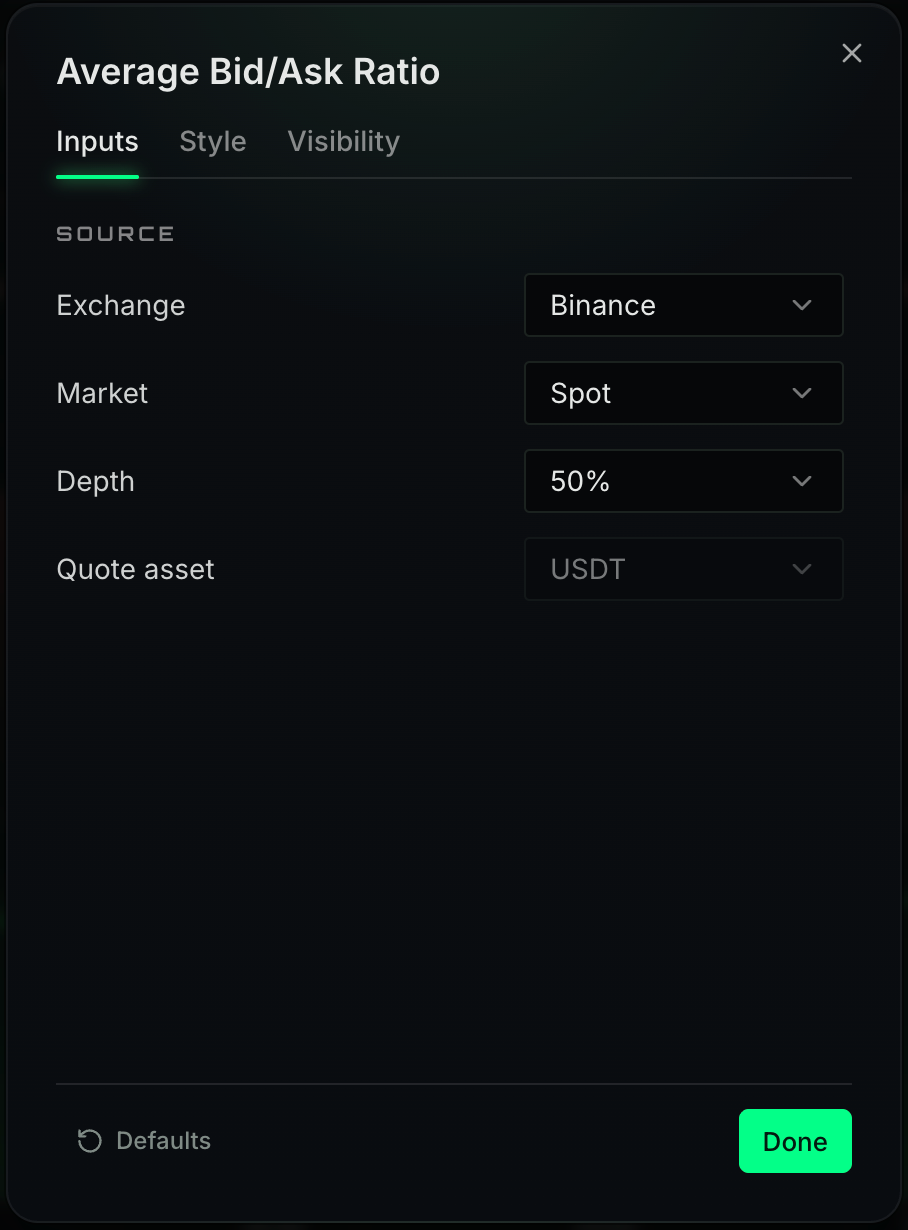
Adjust the Exchange and the depth levels in the configuration panel. The market is fixed to Spot.