// Indicator Manual
Liquidation Bubbles
Plot actual forced liquidation events on the chart and separate completed events from predicted pools.
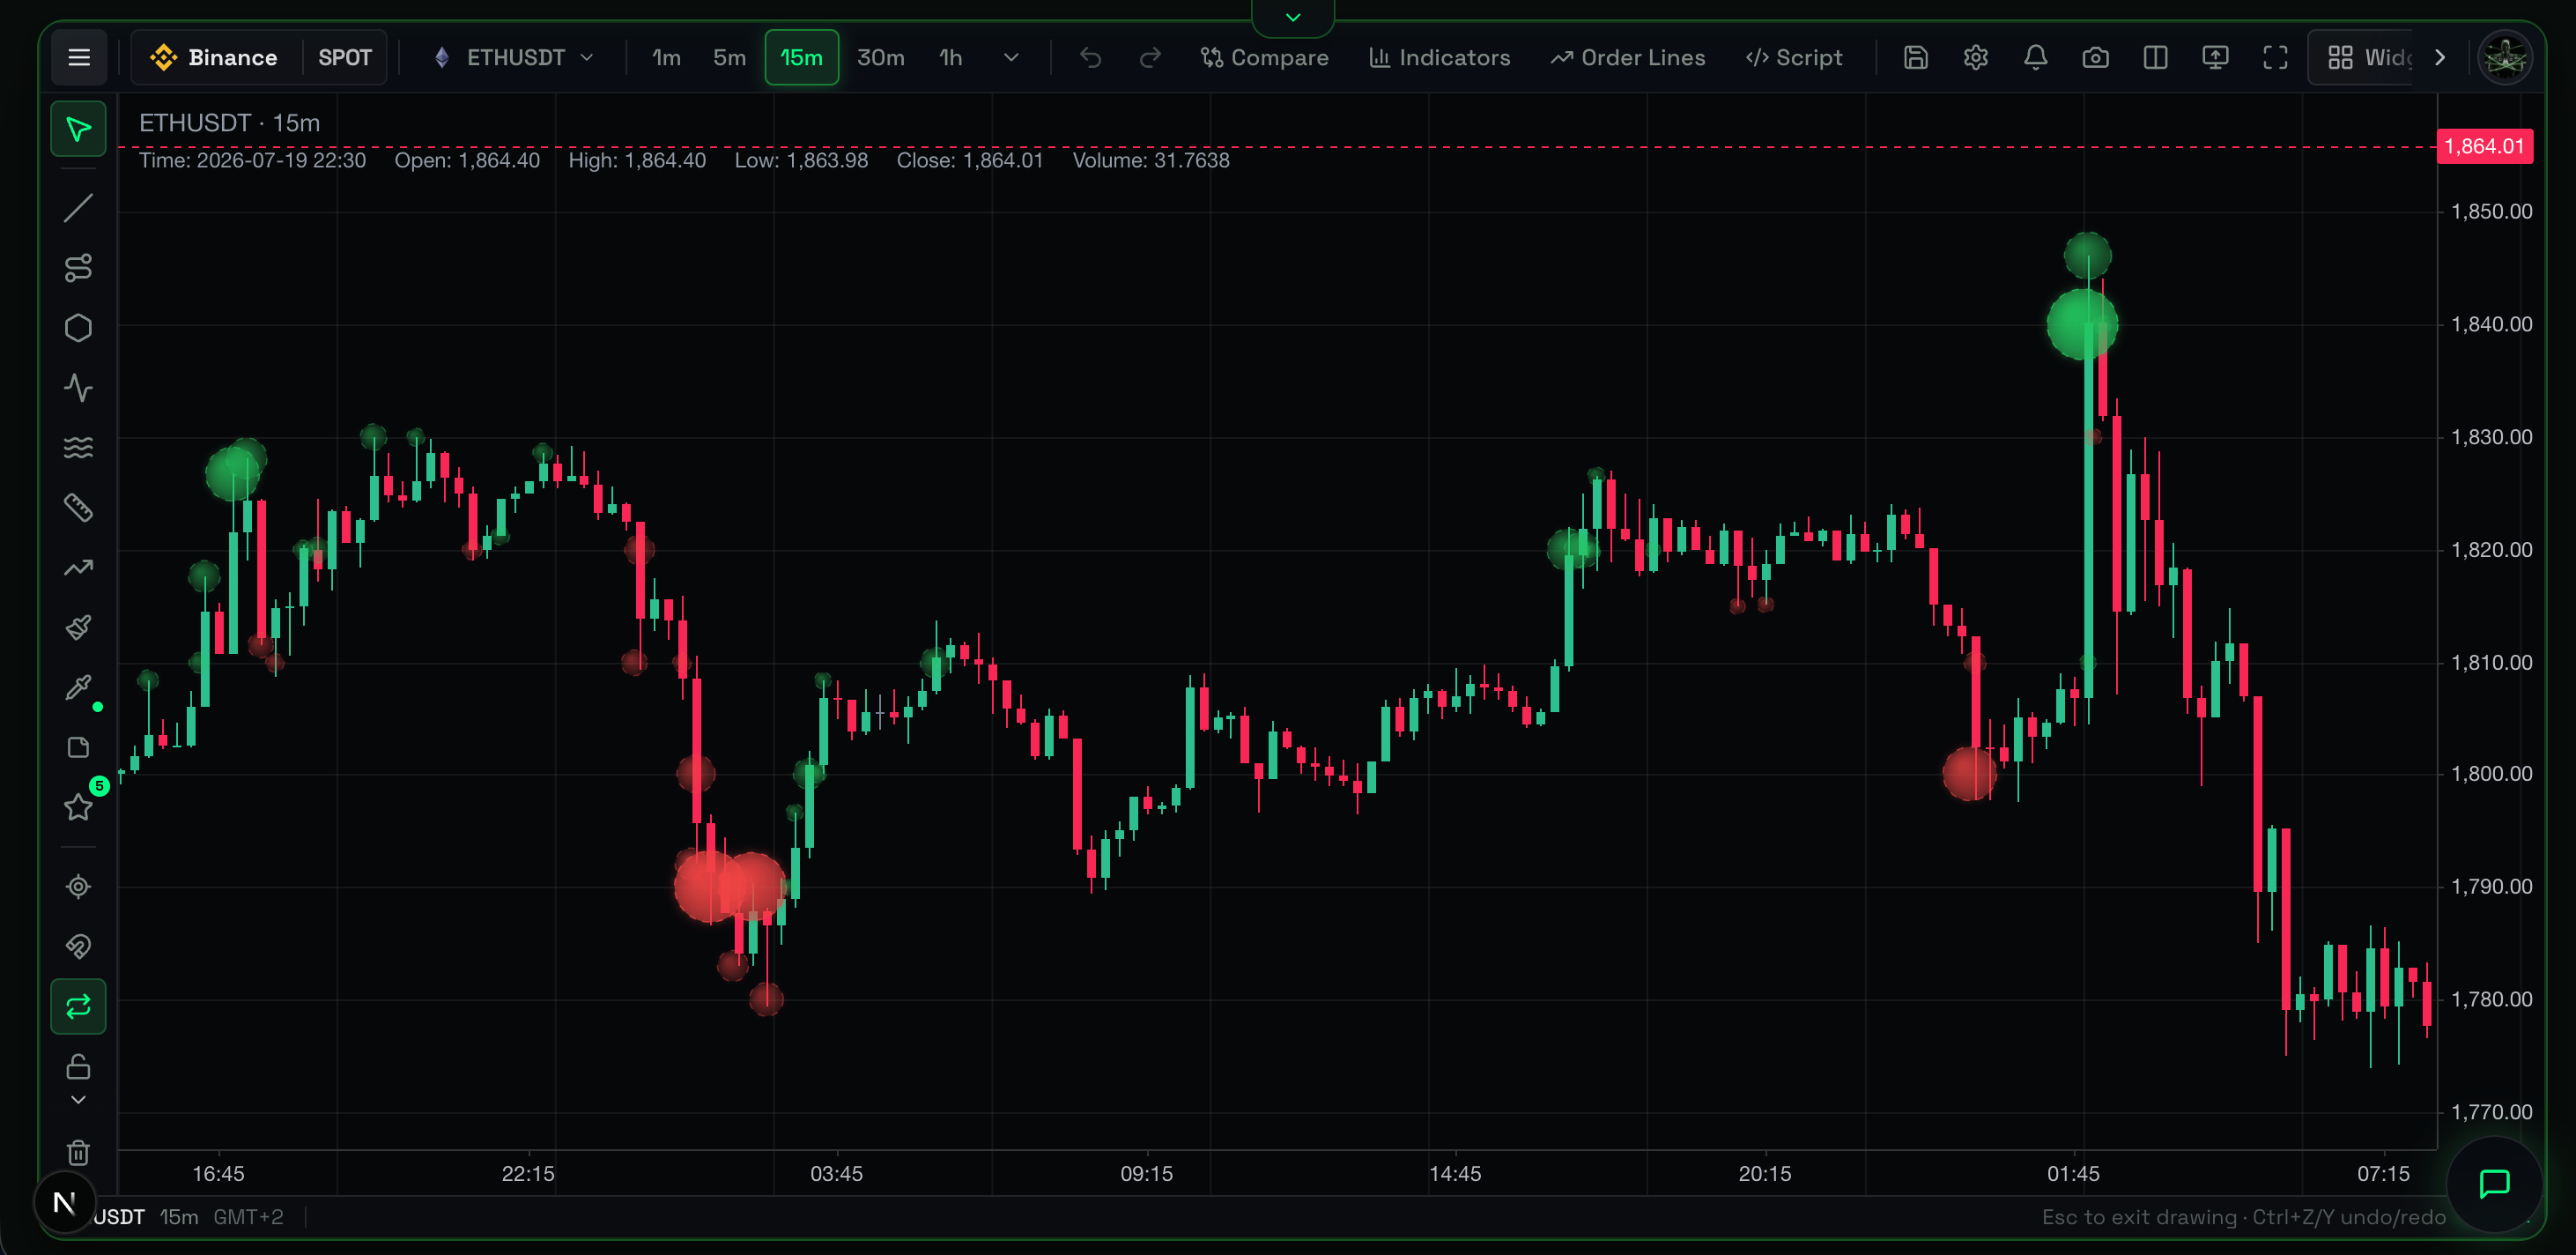
Overview
Liquidation Bubbles plot the exact moments when over-leveraged traders are forcibly closed out by their exchange. By visualizing these forced market orders directly on the chart, traders can instantly spot where the crowd capitulated and where a move exhausted itself.
What It Shows
This indicator captures real-time liquidation websocket feeds from the exchange.
- Bubble Location: The exact price and time the forced liquidation happened.
- Bubble Size: The relative size (dollar value) of the liquidated position.
- Red Bubbles (Long Liquidations): A long position was forcibly sold into the market.
- Green Bubbles (Short Liquidations): A short position was forcibly bought into the market.
Note on Visuals: The renderer clusters nearby events when zoomed out, preventing unreadable overlapping circles.
Why It Matters
Liquidations are non-negotiable, forced market orders. When a massive long position is liquidated, the exchange fires a massive market sell order to close it. This often drives the price down further, triggering a liquidation cascade. Knowing where these forced orders happen allows you to fade the panic (buy the dip) or ride the squeeze (go long when shorts cover).
How to Read It
- Small, scattered bubbles: Background noise of high-leverage retail getting chopped up. Not highly actionable.
- Massive single bubbles: A "whale" getting liquidated. This often marks a local top or bottom because the forced order creates a huge supply/demand imbalance.
- Clustered cascades (waterfalls): A string of red bubbles pushing price down, or green bubbles pushing price up (a liquidation cascade).
Practical Use Cases
- Spotting Capitulation (Reversals): If the price crashes and prints a massive cluster of red bubbles, but immediately bounces back, institutional limit buyers absorbed the forced selling. The selling pressure is exhausted, signaling a long entry.
- Confirming Breakouts: If the price breaks through resistance and triggers a massive cluster of green bubbles (short liquidations), the breakout trapped the bears and the short squeeze is active.
- Taking Profit: If you are long and see a massive string of green bubbles (shorts being liquidated), forced buying is pushing the market. Natural buyers are depleted. Take profit.
Example Scenario
Ethereum grinds down slowly all day. Suddenly, it drops $100 in a single 1-minute candle. You see a giant cluster of Red Liquidation Bubbles at the bottom wick of the candle. Immediately after those bubbles print, the price snaps back up $50. Late-longers panicked and were forcibly liquidated, and smart money stepped in to buy their forced selling. You go long, confident the immediate selling pressure is gone.
Common Mistakes
- Confusing it with the Heatmap: The Liquidation Heatmap predicts where liquidations might happen. The Liquidation Bubbles show where liquidations actually happened.
- Buying every red bubble: Just because a long got liquidated doesn't mean the price will bounce. In a strong downtrend, a red bubble is just fuel for the fire. Wait to see if the price absorbs the liquidation (fails to go lower) before going long.
Limitations
- It is purely historical/event-based. It does not predict future liquidations.
- In low-leverage markets or spot-only assets, bubbles will be non-existent or irrelevant.
- Requires high volatility to generate actionable signals.
Related Indicators
- Liquidation Heatmap: Predict the destination with the Heatmap, and confirm arrival with the Bubbles.
- Footprint Chart: Look inside the candle where the bubble printed to see exactly how the market orders were absorbed.
- CVD (Cumulative Volume Delta): Check if broader aggressive flow agrees with local liquidation events.
For Advanced Users
Asset Class Context
Liquidations only happen where leverage is used. The bubbles automatically display forced liquidations from the Futures market, even if your main chart views a Spot pair. This ensures you never miss a squeeze, regardless of the ticker you trade.