// Indicator Manual
JavaScript Indicators
Build your own indicator in the Script Editor — ready-made examples, the built-in calculation toolbox, and how to put your indicator on the chart.
What this is for
Every indicator in QUANTIX was written by somebody. The Script Editor lets that somebody be you: describe what you want to see, and it draws on the chart beside the built-in tools.
If you have used TradingView, this is our answer to Pine Script. The difference is the language — here it is JavaScript, so anything you find in a tutorial, an article or an AI assistant works as written.
You do not have to write it from scratch
The editor opens with a working indicator already in it. Change a number, press Save & Run, and watch the chart. That is a complete first session — everything below is for when you want more.
Your first indicator in five steps
- Open the terminal and press the
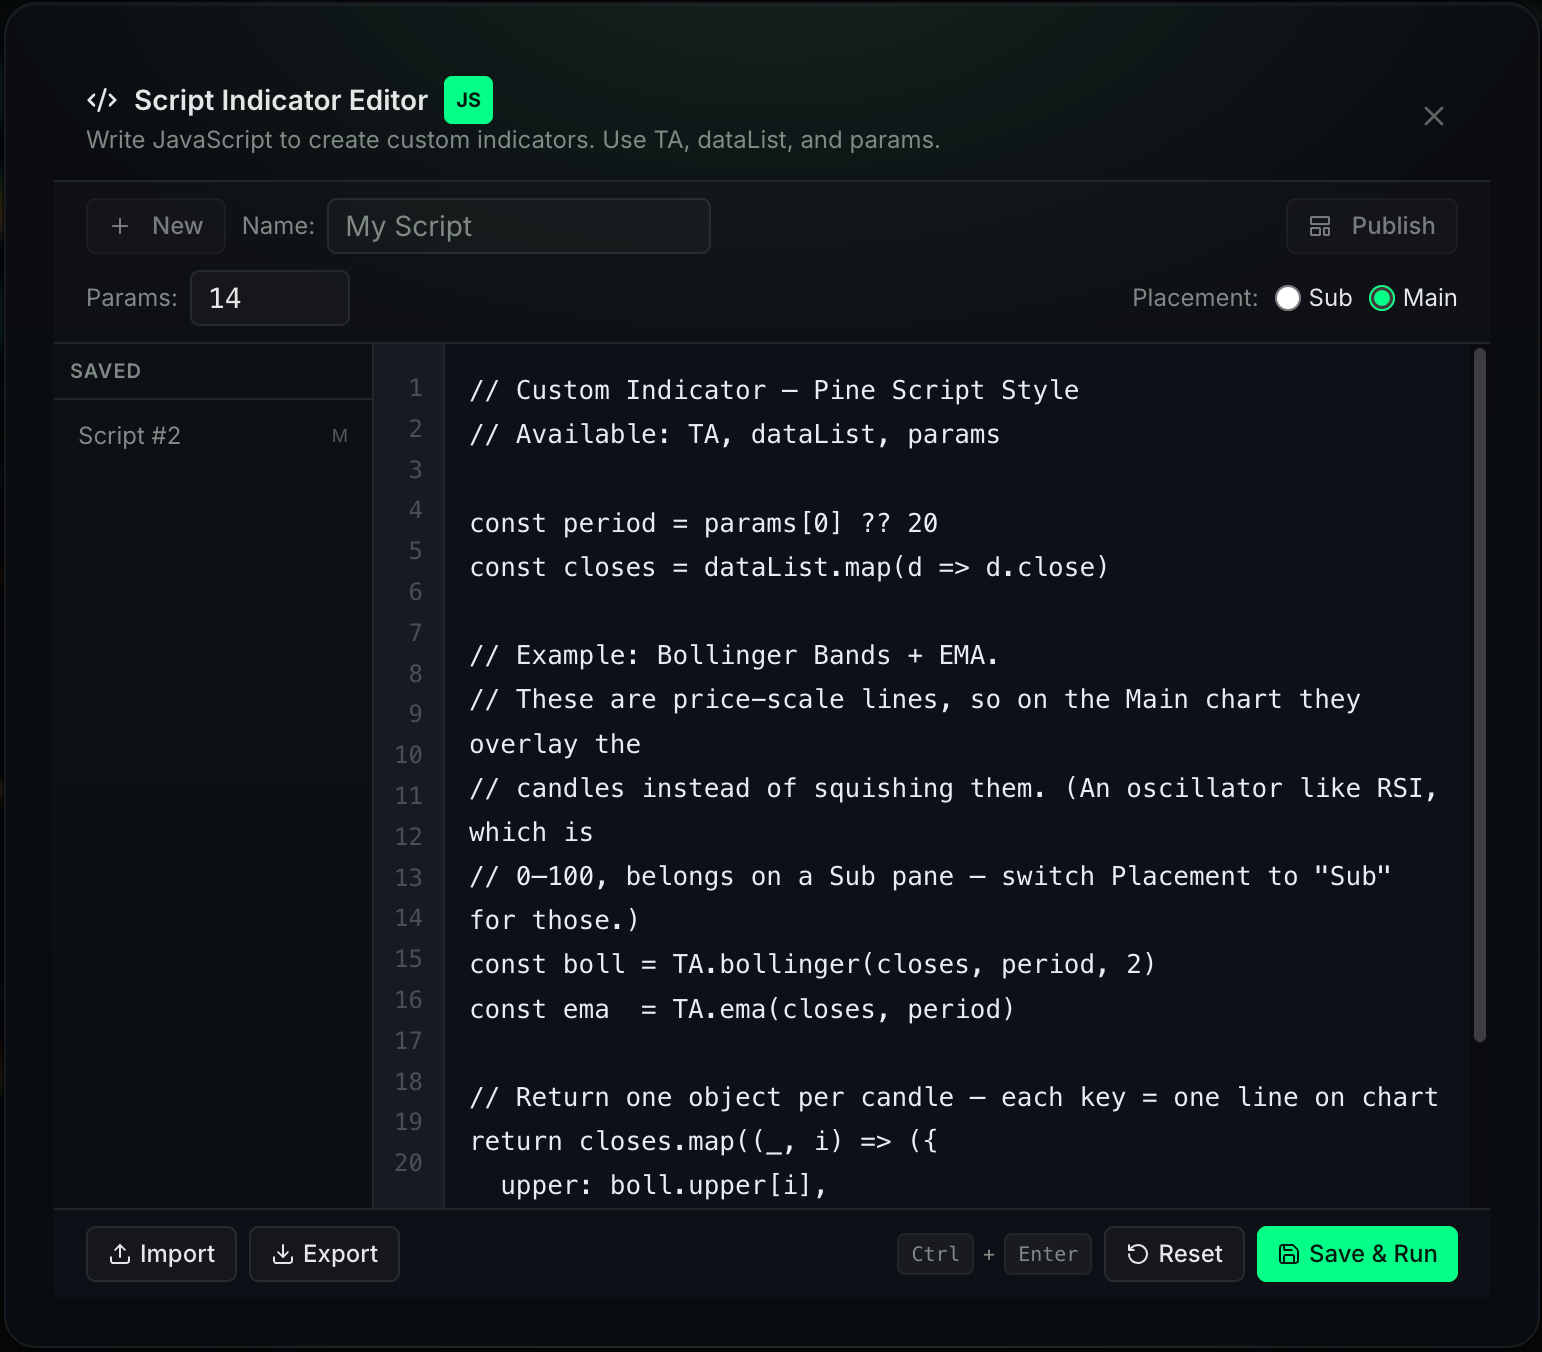
</>Script button in the toolbar. - Give it a name in the Name field — that is how it will appear in your indicator list.
- In Params, put the number the indicator should use. In the example that opens,
20is the length of the average. - Choose Placement: Main draws over the candles, Sub opens a separate panel underneath. More on choosing below.
- Press Save & Run (or Ctrl / ⌘ + Enter). The indicator appears on the chart, and from now on it lives in Indicators → Custom with all the others.
That is the whole cycle. Everything else on this page is about what you can put in the middle.
Main or Sub — choose before you write
This one choice decides whether your indicator is readable.
- Main — on the chart itself, on the price scale. Correct for anything measured in money: moving averages, bands, channels, levels.
- Sub — in its own panel below, with its own scale. Correct for everything else: an RSI running 0 to 100, a delta, a ratio, a volume figure.
Put an oscillator on Main and the price scale stretches from 0 to 100 to fit it — the candles collapse into a flat thread. If your chart suddenly looks empty, this is almost always why.
The three things your indicator has
Think of the editor as a small kitchen. Three things are on the counter, and you decide what to cook.
The candles — dataList
Every candle on screen, oldest first. From each one you can take:
| What you write | What it gives you |
|---|---|
d.close | Closing price |
d.open | Opening price |
d.high / d.low | High and low |
d.volume | Volume |
d.timestamp | Candle time |
The usual first line of an indicator collects one of them for the whole history:
const closes = dataList.map(d => d.close)Your numbers — params
Whatever you type in the Params field, separated by commas, arrives as params[0], params[1], and so on. This is what makes an indicator adjustable instead of fixed:
// Params: 20, 2
const period = params[0] ?? 20
const width  = params[1] ?? 2
The ?? 20 part is the value used if the field is empty. Always leave one in — it is what keeps the indicator working before anyone fills the field.
The toolbox — TA
The standard calculations, already written and tested. You give one a list of prices and a length, it hands back the result:
const ema = TA.ema(closes, period)| Call it like this | And you get |
|---|---|
TA.sma(prices, length) | Simple moving average |
TA.ema(prices, length) | Exponential moving average |
TA.wma(prices, length) | Weighted moving average |
TA.hma(prices, length) | Hull moving average |
TA.rma(prices, length) | Wilder's smoothing (the one inside RSI and ATR) |
TA.stdev(prices, length) | Standard deviation — how far price strays from its average |
TA.rsi(prices, length) | RSI, 0 to 100 |
TA.macd(prices, fast, slow, signal) | MACD: dif, dea and macd together |
TA.bollinger(prices, length, width) | Bollinger Bands: upper, mid, lower |
TA.tr(highs, lows, closes) | True Range |
TA.atr(highs, lows, closes, length) | Average True Range — volatility |
TA.vwap(highs, lows, closes, volumes) | VWAP |
TA.cci(highs, lows, closes, length) | CCI |
What your indicator has to give back
One value per candle, for each line you want drawn. The last line of the script says which lines exist and what they are called:
return closes.map((_, i) => ({
  fast: fastEma[i],
  slow: slowEma[i],
}))
Two names, two lines on the chart, named fast and slow in the legend. Add a third name and you get a third line — up to 24 of them.
The first candles are usually empty
A 20-period average has nothing to show until 20 candles have passed, so the line starts a little way in from the left edge. That is correct, not a bug — the indicator is refusing to draw a number it does not have.
Ready-made examples
Copy any of these into the editor, change the numbers, press Save & Run.
Two moving averages (Placement: Main)
The classic. Params: 50, 200
const fastLength = params[0] ?? 50
const slowLength = params[1] ?? 200
const closes = dataList.map(d => d.close)

const fast = TA.ema(closes, fastLength)
const slow = TA.ema(closes, slowLength)

return closes.map((_, i) => ({
  fast: fast[i],
  slow: slow[i],
}))
Bollinger Bands with an average (Placement: Main)
This is the script the editor starts with. Params: 20
const period = params[0] ?? 20
const closes = dataList.map(d => d.close)

const boll = TA.bollinger(closes, period, 2)
const ema  = TA.ema(closes, period)

return closes.map((_, i) => ({
  upper: boll.upper[i],
  basis: boll.mid[i],
  lower: boll.lower[i],
  ema:   ema[i],
}))
RSI with its levels (Placement: Sub)
The last two lines are fixed numbers, so they draw as flat guide levels at 70 and 30. Params: 14
const period = params[0] ?? 14
const closes = dataList.map(d => d.close)
const rsi = TA.rsi(closes, period)

return closes.map((_, i) => ({
  rsi: rsi[i],
  overbought: 70,
  oversold: 30,
}))
Volatility, to size a stop (Placement: Sub)
ATR says how far this instrument moves in an average candle — useful for choosing a stop distance that is not arbitrary. Params: 14
const period  = params[0] ?? 14
const highs   = dataList.map(d => d.high)
const lows    = dataList.map(d => d.low)
const closes  = dataList.map(d => d.close)

const atr = TA.atr(highs, lows, closes, period)

return closes.map((_, i) => ({
  atr: atr[i],
}))
Buying and selling pressure (Placement: Sub)
Nothing limits you to the standard set. This one asks a question the toolbox has no name for: within each candle, did price spend its time near the high or near the low, and how much volume backed that? Params: 21
const period = params[0] ?? 21

const pressure = dataList.map(d => {
  const range = d.high - d.low
  if (!range) return 0
  const position = (d.close - d.low) / range   // 1 = closed on the high, 0 = on the low
  return (position - 0.5) * 2 * (d.volume ?? 0)
})

const smoothed = TA.ema(pressure, period)

return pressure.map((_, i) => ({
  pressure: smoothed[i],
  zero: 0,
}))
Above the zero line, candles are closing near their highs on real volume. Below it, near their lows.
Managing your indicators
- Saved on the left of the editor lists everything you have written. Click one to open it.
- New clears the editor for the next idea; your saved scripts stay where they are.
- Reset puts the starter example back in the editor. It never touches anything saved.
- Indicators → Custom is where your finished indicators live — switch them on and off, hide them, delete them, or press the pencil to open one back in the editor.
Your scripts are stored in your browser. Turn Cloud Sync on and they travel with your account to every device you sign in from.
Sharing and backups
Export saves the current script as a file. Import loads one back. That file is the indicator itself — send it to a colleague, keep it as a backup, or store your collection in a folder.
Indicators published by the QUANTIX team appear in Indicators → Custom as templates. You can use them as they are; to make one your own, export it, change what you want, and save it under a new name.
Is it safe?
Your indicator only reads candles and draws. It has no way to reach the internet, your account, your funds or anything outside the chart, and it runs apart from the rest of the terminal, so a mistake in a script cannot break the platform. A script that gets stuck in a loop is stopped after a second and a half and reported to you.
The practical limits: up to 24 lines drawn, the last 20 000 candles as history, and a script of up to 24 000 characters — several pages of calculations.
Coming from TradingView
| In Pine Script | Here |
|---|---|
indicator() / study() at the top | The Placement switch: Main or Sub |
input.int(20) | The Params field, read as params[0] |
plot(series) | A name in the returned list |
ta.sma(close, 20) | TA.sma(closes, 20) |
na | null |
request.security() — another symbol or timeframe | Not available: an indicator sees the chart it is on |
strategy() and backtesting | Not available: this draws indicators, it does not test trades |
One habit to unlearn: Pine walks through the candles for you, one at a time. Here you are handed the whole history at once and say what to do with all of it — which is why every example ends with map, the instruction that means "for every candle".
If something does not appear
| What you see | What it means |
|---|---|
| "Script must return an Array" | The last line does not start with return, or it returns one value instead of one per candle. |
| The candles turned into a flat line | An oscillator on the Main pane. Switch Placement to Sub. |
| The line starts away from the left edge | Normal — the indicator has no value until enough candles have passed. |
| "Timeout" | The calculation never finishes. Usually a loop inside a loop; take the heavy part outside it. |
| Nothing drawn, and no error | Your values came out empty. Return a fixed number for a moment, for example { test: 1 }, to check the line appears — then put the real calculation back one piece at a time. |
Ask for help writing one
Because this is ordinary JavaScript, you can describe an indicator in words to any AI assistant, ask for it as a JavaScript function, and paste the result here. Tell it two things: the values come from dataList (with close, open, high, low, volume), and the script must return one object per candle.